Visualization
Showing the stories in data through statistics, design, aesthetics, and code.
What Kind of Information is Hidden in Barcodes?
Barcodes. We all know what they look like. They’re the black stripes that…
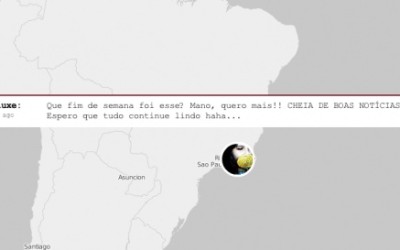
Watching Our Twitter World – twittervision Redux
See what people are tweeting around the world 24/7. What are you doing right now?
There’s More Than One Way to Skin a Dataset
Last week I asked if you could improve a mediocre bar chart showing…
Mapping Walkability in San Francisco
Lee Byron, recent Carnegie Mellon grad and newly inducted New York Times graphics…
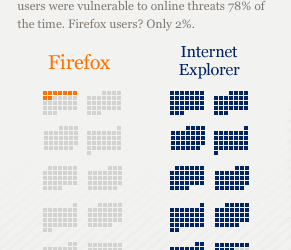
Shouldn’t You Be Using Firefox By Now?
I’ve been using Mozilla Firefox for years and have nothing but good things…
Martin Wattenberg On Visualizing Large Textual Data
Martin Wattenberg, one of the creators of Many Eyes, in reply to “Why…
Weekend Minis for Your Lazy Weekend – 7/19/08
BedPost – I put this up earlier for the FlowingData personal visualization project,…
Can You Improve this Mediocre Statistical Graphic?
I’m on my way back home from the workshop Integrating Computing into the…
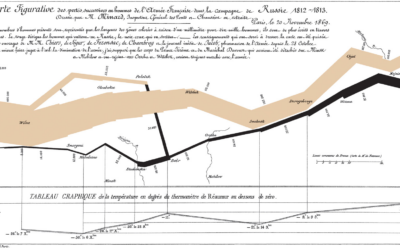
Is Napoleon’s March the Greatest Statistical Graphic Ever?
I am starting to hear about Charles Minard’s map of Napoleon’s march time…
Browse Your del.icio.us Bookmarks as Thumbnails
I bookmark stuff with del.icio.us almost every day, and it’s become indispensable, because…

Radiohead Music Video by Capturing and Rendering 3D Data
Radiohead’s most recent music video, House of Cards, was made entirely without cameras.…
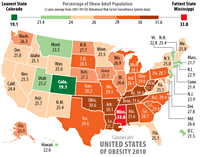
Mapping Economic Activity for the World
The G-Econ (Geographically-based Economic data) group has worked on making economic data publicly…
Map With All the Common APIs at Once – Mapstraction
For those who want more out of the commonly-used mapping APIs from Google,…
The Girl Effect – Beautiful Use of Animated Typography
The Girl Effect – “the idea that adolescent girls are uniquely capable of…
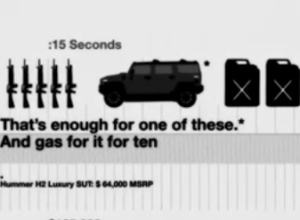
Infographics Movie: Cost of the War In Iraq
In the time that it takes you to watch this movie, the US…
Hacking the Coffee Maker – Caffeine Viewer
The colmeia group recently installed their Caffeine Viewer project where they hacked their…
Statistical Graphics Conference – Jet Lag Wins. I Lose.
As you might have noticed, I haven’t been live blogging the Data Viz…