Visualization
Showing the stories in data through statistics, design, aesthetics, and code.
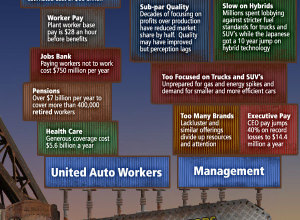
Visual Guide to General Motors’ Financial Woes
As you’ve probably heard, General Motors has come on some financial troubles and…
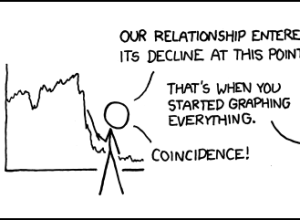
Graphs Lead to Decline in Love
Coincidence. Absolutely. Lisa Simpson agrees. Have a good weekend all.
[via xkcd |…
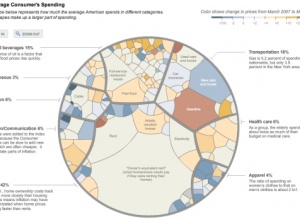
9 Ways to Visualize Consumer Spending
GOOD Magazine’s most recent infographic (above and below) on consumer spending got me…
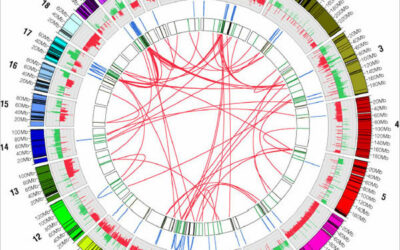
Researchers Map Chaos Inside Cancer Cell
The thing about cancer cells is that they suck. Their DNA is all…
Budweiser Maps Drinkabilty of Bud Light Beer
Yes, watered down and flavorless beer has high drinkability. You know, sort of…
Urban Heartbeat of European Cities – Urban Mobs
During major events, people use their mobile phones to share their emotions: the…
Because It’s Friday
Have a good weekend all. I’ll be getting buried in the expected 12…

5 Best Data Visualization Projects of the Year
Data visualization continues to grow online and in the real world. It exists…
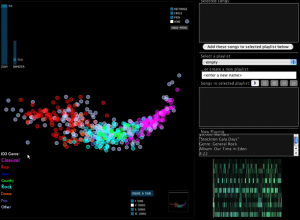
Visualize Music Collections With MusicBox
The great thing about being a graduate student is that you get to…

Sculptural Data Visualization – Stock Market and GDP
In his latest data sculptures, Andreas Nicolas Fischer places data visualization in a…
Winner of Tufte Books and Many Other Good Entries
I ran a contest last week to improve a graph from Swivel that…
What Jobs Are There in Data Visualization?
I got an email from Harald asking, “How does the job market for…
Navigate Articles, Photos, and Video from Around the Globe
The Washington Post recently put up TimeSpace: World, which is an interactive map…
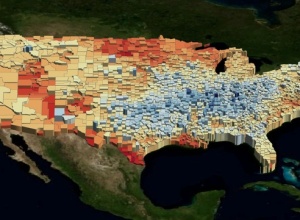
Explore and Analyze Geographic Data with UUorld
UUorld (pronounced “world”) is a 4-dimensional mapping tool that lets you explore geographic…
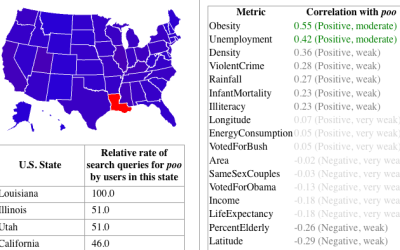
Guess What State Searches for ‘Poo’ the Most – StateStats
StateStats is like Google Insights but on a state level. Type in a…
Typographic Illustration for Jay-Z’s ‘Brooklyn Go Hard’
Evan Roth from the Graffiti Research Lab, uses typographic illustration in Jay-Z’s music…
Visualization Projects from Database City – Visualizar’08
This is a guest post by Greg J. Smith, a Toronto-based designer and…
Neighborhood Boundaries with Flickr Shapefiles
Neighborhood Boundaries by Tom Taylor uses Flickr Shapefiles and Yahoo! Geoplanet “to show…