Visualization
Showing the stories in data through statistics, design, aesthetics, and code.
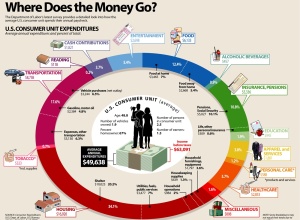
How Does the Average Consumer Spend His Money?
Add another graphic to the list of ways to show consumer spending. Visual…
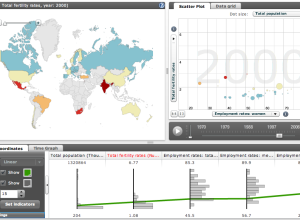
Explore World Data with Factbook eXplorer from OECD
The Organization for Economic Co-operation and Development (OECD) makes a lot of world…
Religious Teachings On Sex
This graphic on religious teachings and sex is making the social media rounds.…
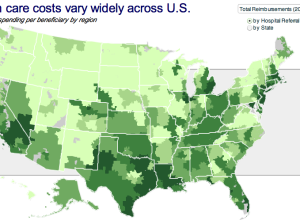
Health Care Costs Vary Widely By Region
No, this isn’t a bad fungus spreading northwest towards Washington. This map from…
Colored Tree, Cookies, and Stairs in Visualization Ad
These ads for Hospital Alemán from Saatchi & Saatchi color code physical items…
Is the Economy Getting Ready to Turn Around?
Is the economy going to turn around any time soon? How does this…
Realtime Information Graphics Show International Data Interchange
Zum Kuckuck, a design group in Germany, visualizes data interchange and network traffic…

X-Men Universe Relationship Map
Contrary to what a lot people might think they know from the movies,…
Infographic Provides a Twitter History Lesson
Manolith, in collaboration with InfoShots, tells the story of Twitter. The graphic starts…
Michael Jackson Billboard Rankings: the Man, the Legend
Say what you want about Michael Jackson, but there’s no denying the great…
Does this Calorie Intake Infographic Work? Not Really
How long does it take to burn off the calories from a Big…
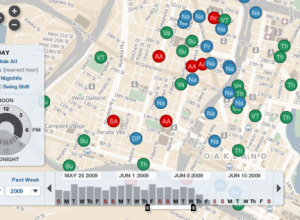
20 Visualizations to Understand Crime
There’s a lot of crime data. For almost every reported crime, there’s a…
Business Valuation Calculator Like Trendalyzer With Style
Inc.com just released their annual valuation guide for 2009, which allows business owners…
Abortion Rates in the United States, 1970-2005
I’ve been working on my mapping skills lately in preparation for the first…
Designing Interfaces for the Star Ship Enterprise
We’ve all seen the new Star Trek by now. If you haven’t, you…
World Map of Social Network Dominance
Vincenzo Cosenza maps social network dominance around the world according to traffic data…
Javascript InfoVis Toolkit – New Version Released
As we’ve seen, javascript is growing into a viable solution for visualization on…
GOOD Magazine’s Infographics Now Archived on Flickr
You know all those infographics that you like so much from GOOD Magazine?…