Visualization
Showing the stories in data through statistics, design, aesthetics, and code.

In perspective: One hour of video uploaded to YouTube per second
YouTube surpassed the one hour of video uploaded per second threshold recently. To…
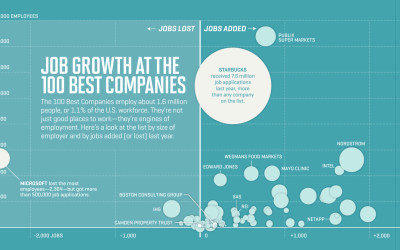
Job growth at the best companies to work for
Nicolas Rapp and Anne Vandermey with a straightforward look at new jobs added…
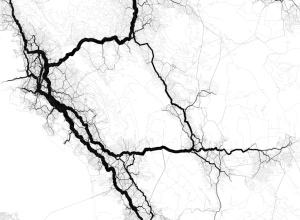
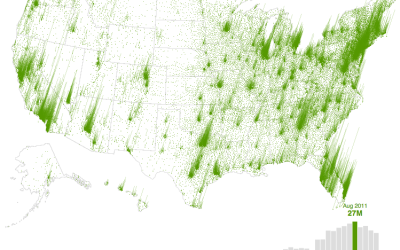
Geographic connectedness via Twitter locations
Eric Fischer has mastered the art of making use of geotagged things from…
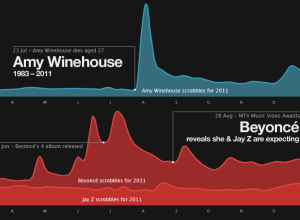
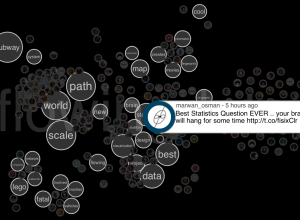
Music listening trends and the news in 2011
Anyone who uses a social music service like Rdio or last.fm has probably…

SOPA opposition surges
ProPublica has been tracking members of Congress who oppose and support SOPA. You…
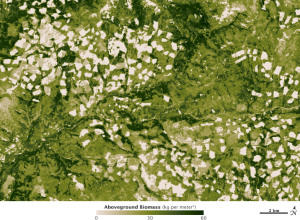
High resolution biomass map, at management scale
In 2010, NASA released a map that shows world forest heights. Robert Simmon,…
Watching ‘wtf Wikipedia’ as SOPA/PIPA blackout begins
While SOPA and PIPA are no laughing matter (join the strike), the reaction…
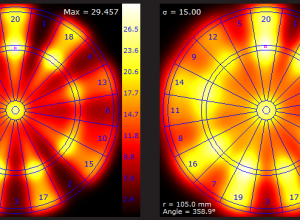
Optimized dart throwing and other games
If you play darts just trying to hit the bullseye, you aren’t playing…
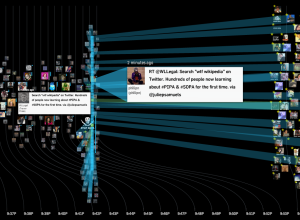
Spot visualizes tweet commonalities
Twitter is an organic online location, full of retweets, conversations, and link sharing.…
Find out what percent you are in
Accompanying an article on the variations of the wealthiest one percent, The New…
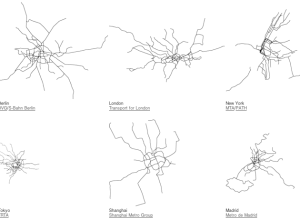
World subway paths at scale
Urban planner Neil Freeman maps the world’s subway systems to scale in a…

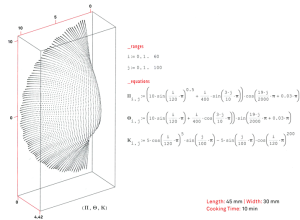
Cinemetrics creates a visual fingerprint for movies
As we saw with movie barcodes, each film has a uniqueness that can…
New Hampshire results trackers
The New Hampshire results trackers are out in full force tonight. Ordered by…
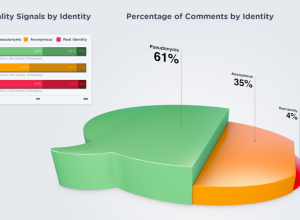
Pie step comment bubble 3D thing
This graphic by commenting platform DISQUS, arguing that higher quality online discussions come…
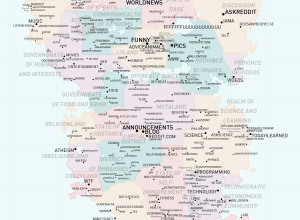
Map of Reddit
Reddit user Laurel Quade mapifies the wonderful world of Reddit. Each country represents…
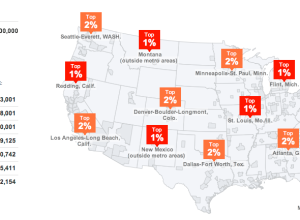
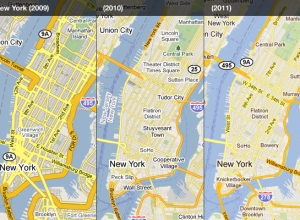
Where people are looking for homes
In August 2006, real estate search site Trulia had 609,000 visitors. Five years…