Visualization
Showing the stories in data through statistics, design, aesthetics, and code.

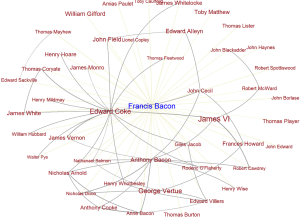
Six Degrees of Francis Bacon, a 17th century social network
These days it’s relatively easy to figure out connections between people via email,…
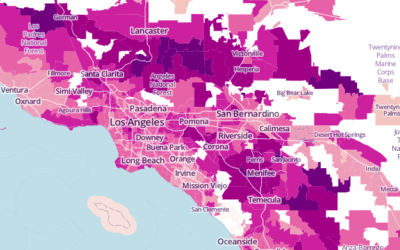
Average commute times mapped →
The United States Census Bureau just released county-level commute estimates for 2011, based…
Teaching 2nd Graders About Maps
Cartographer Gretchen Peterson taught 70 second graders about maps. She talks about her…
SimCity 2013 is coming tomorrow
I’m not into video games, and my experience has been near zero since…
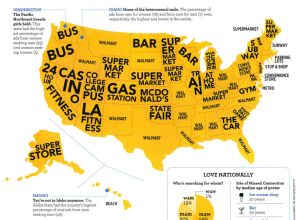
Stately: A simple map font
Add another way to make state-level choropleth maps. Stately, a project by Intridea,…
CS547
The Stanford seminar lectures on human-computer interaction are all free to view online.…
Finding and Making Sense of Geospatial Data on the Internet
Steven Citron-Pousty provides a thorough primer on finding and making sense of geospatial…
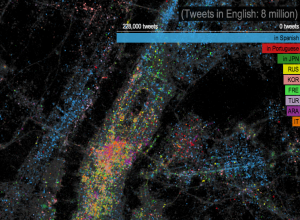
Languages of New York, via Twitter
In a follow-up to their map on most used languages in London, James…
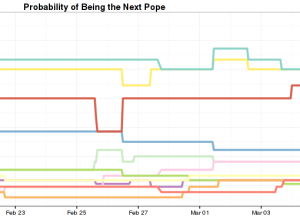
Pope face composite
With Pope Benedict XVI’s resignation, 116 cardinals from various regions have to come…
Curved Paths →
Possible path drawing in video games [via]…
Map of Craigslist Missed Connections
On Craigslist there’s a section in the personals for “missed connections” which lets…
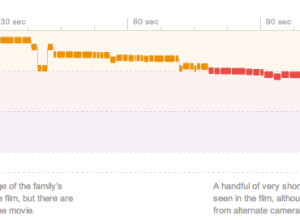
A dissection of movie trailers →
Shan Carter, Amanda Cox, and Mike Bostock for The New York Times, analyzed…
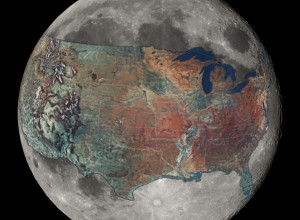
U.S. overlaid on the Moon for a sense of scale
How big is the Moon, really? Reddit user boredboarder8 provided some perspective with…
A shroud of cold air descends on the U.S.
From NOAA, an animation showing a wave of cold during the Martin Luther…
Chart Check: Did Obama’s Graphics ‘Enhance’ His Big Speech? →
Helped out some for this NPR article…
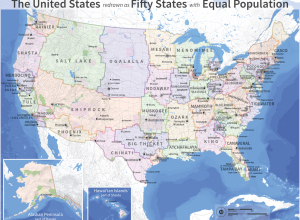
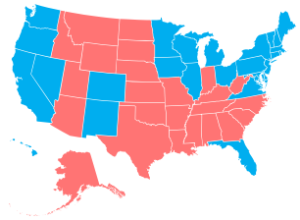
Redrawn United States of electoral votes
Neil Freeman reimagined state boundary lines based on population. He started with an…