Visualization
Showing the stories in data through statistics, design, aesthetics, and code.
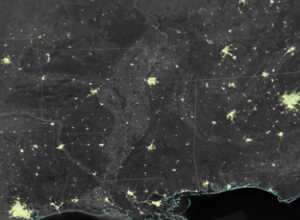
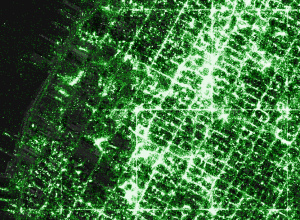
Holiday lights from space
You’ve likely seen the classic globe image that shows Earth at night. It’s…
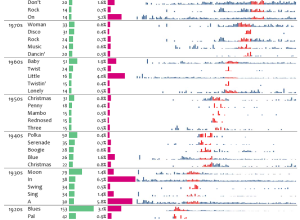
Most decade-specific words in Billboard song titles
David Taylor looked for words in Billboard song titles that appeared during a…
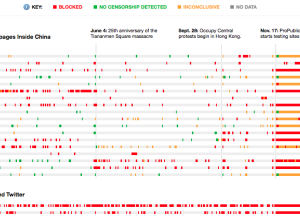
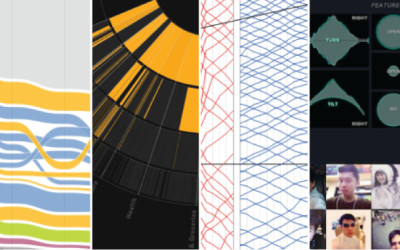
The Best Data Visualization Projects of 2014
It's always tough to pick my favorite visualization projects. Nevertheless, I gave it a go.

Collection of physical visualizations
I’m pretty sure there’s a ton of untapped potential in data represented physically.…
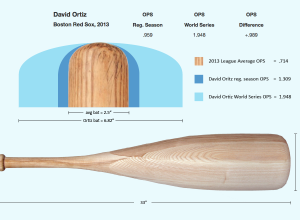
Using baseball bats to display data
When a baseball player is hitting well, commentators will sometimes say that it…
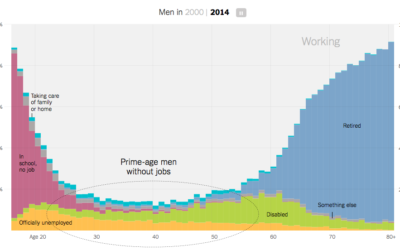
Increasing rates of men who don’t work
Recent data from the Census Bureau suggests the rate of non-working men has…

Physical infographics
Photographer Marion Luttenberger used physical objects and people as her visual cues in…

Book genres for visualization
Martin Wattenberg and Fernanda Viegas from Google Research ran with the book metaphor…
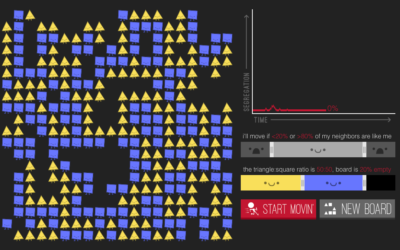
Understanding segregation with a simulation
In 1971, Nobel laureate economist Thomas Schelling proposed that a desire to have…
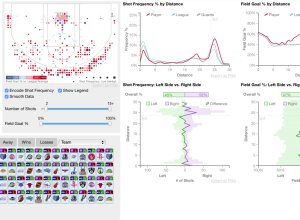
Detailed visualization of NBA shot selection
Sports loves conditional distributions. What does Joe Billy Bob typically do against such…
Make your own detailed tweet maps
Eric Fischer, known around these parts for his detailed dot maps, describes his…
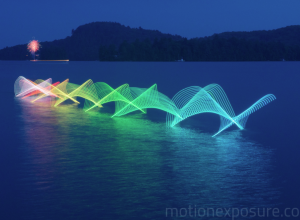
Motion Exposure →
Motion Exposure, a photography project by Stephen Orlando, captures movement patterns with light.…

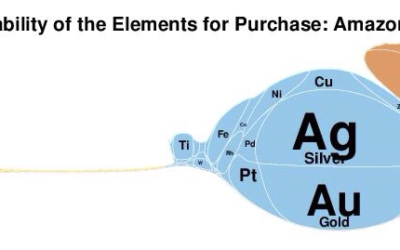
Elemental cartograms
Along the same lines as the scaled Periodic Table, Elemental Cartograms by chemistry…
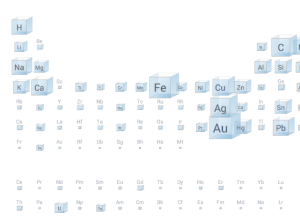
A scaled Periodic Table of Elements
Inspired by a diagram from 1976, the Big Picture group at Google Research…