Visualization
Showing the stories in data through statistics, design, aesthetics, and code.
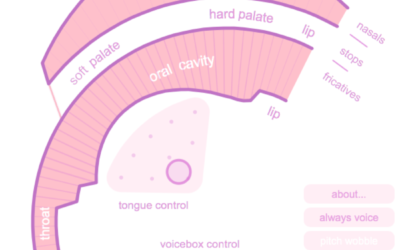
Simulation shows how your mouth works when you talk
You have a mouth with a bunch of tissue in it and manipulate…
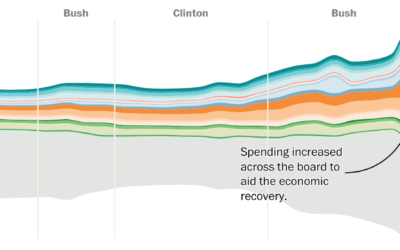
Shifting national budget
The Washington Post looks at the shifting national budget over the past 40…

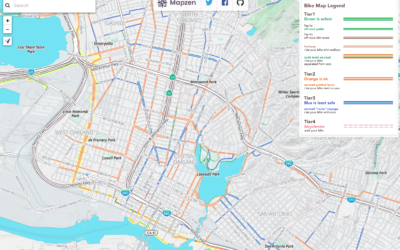
Penrose map binning
Cartographer Daniel Huffman tried out Penrose tiling for binning in maps:
A Penrose…
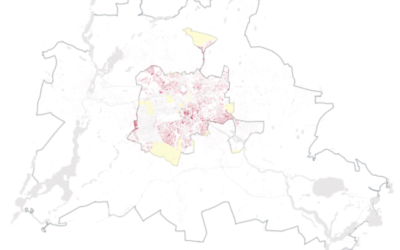
Scale of Aleppo against Berlin and London
A lot of people around the world including myself don’t quite understand the…
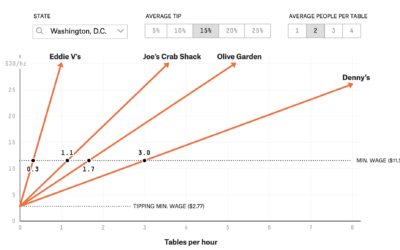
How many tables restaurant servers have to wait on to earn minimum wage
In most states, there is minimum wage and there is tipping minimum wage.…
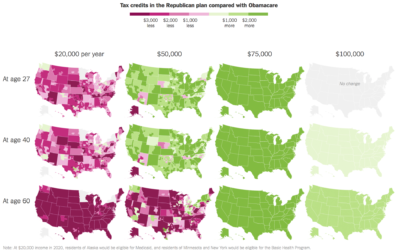
Republicans’ health care plan compared against Obamacare
Based on estimates from the Kaiser Family Foundation, Kevin Quealy and Margot Sanger-Katz…
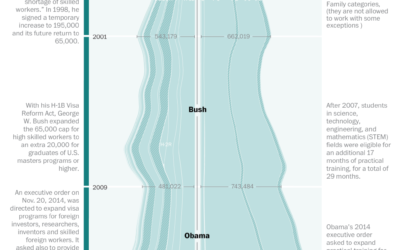
Visa restrictions and possible impact on innovation
The Washington Post talked to three experts on the American workforce and innovation…

Bomb threats to Jewish Community Centers
Ken Schwencke and Al Shaw from ProPublica with a set of straightforward maps…
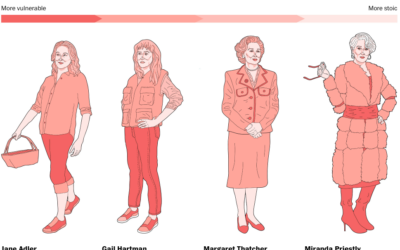
The range of Meryl Streep
Here’s a fun piece from Stephanie Merry and Shelly Tan for The Washington…
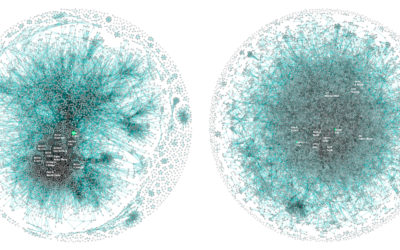
Apple vs. Google company structure, as seen through patents
For Co.Design, Periscopic compared patent ownership between Apple and Google, which ends up…

Bill Paxton tribute through storm spotters’ GPS coordinates
Bill Paxton, who played a storm chaser in Twister, died on Sunday. To…
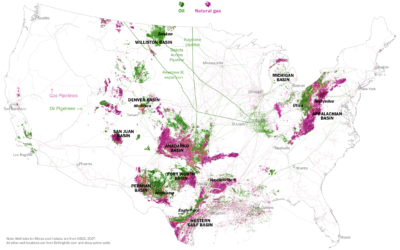
Oil and gas wells in the United States
Tim Meko and Laris Karklis for The Washington Post take a dive into…
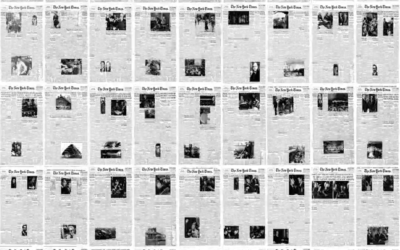
Evolution of The New York Times front page
From Josh Begley, this quickfire flip book shows every New York Times front…

Forest of Numbers
To celebrate the ten-year anniversary of the National Art Center in Tokyo, Emmanuelle…

Graphs from 1900 that depict a snapshot of African American life
In 1900, W. E. B. Du Bois and his students drew a series…