Visualization
Showing the stories in data through statistics, design, aesthetics, and code.
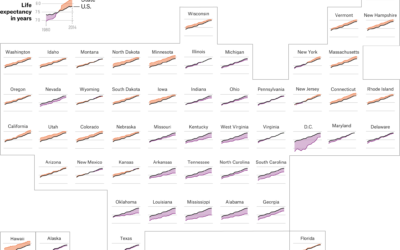
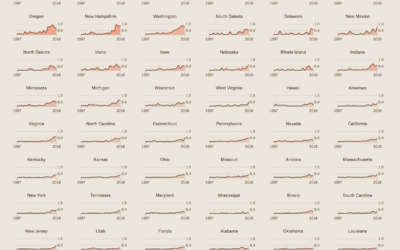
Life expectancy by state, against the US average
FiveThirtyEight continues their look at mortality by geography. This graphic by Anna Maria…
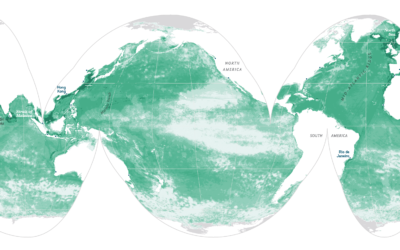
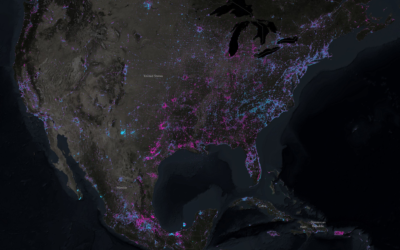
X-Ray of the oceans
Using satellite data and spatial models, researchers estimate human influence in the ocean.…
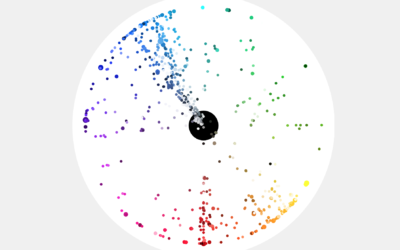
Most popular colors used by most popular sites
Paul Hebert was curious about the colors used on the web’s larger sites,…
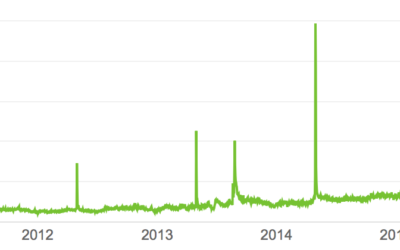
YouTube plays for ‘It’s Gonna Be May’
It’s that time of year again. Turn up the volume and blast It’s…
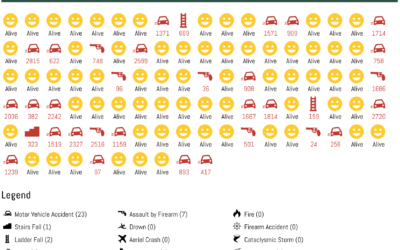
Life expectancy if all diseases were magically cured
Here’s a fun what-if simulation that imagines a world where all natural causes…
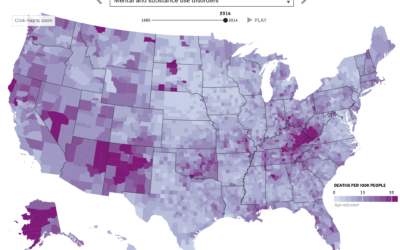
Mapping death in America, 1980 to 2014
Nationwide mortality data relies on death certificates, and when cause of death is…
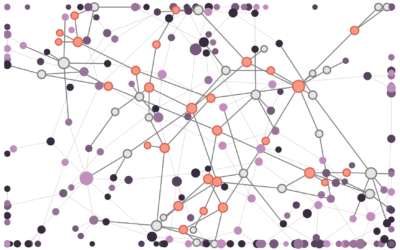
How disinformation spreads in a network
Disinformation is kind of a problem these days, yeah? Fatih Erikli uses a…
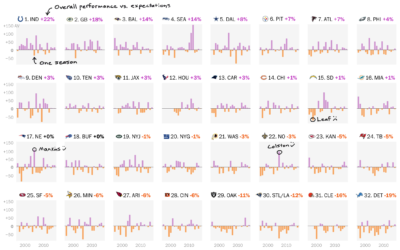
NFL draft performance vs. expectations
Reuben Fischer-Baum for The Washington Post looks at professional football expectations given their…
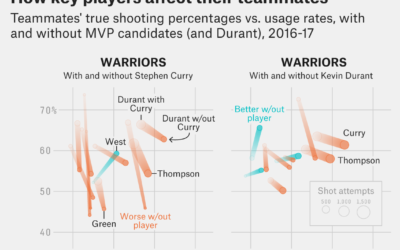
Stephen Curry for MVP, because he makes his teammates better the most
The choice for Most Valuable Player in the NBA is only minimally about…

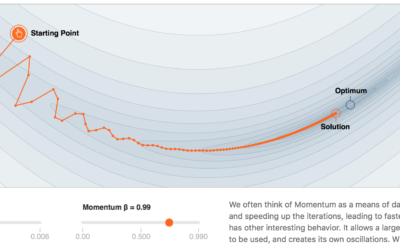
Why momentum works
Gabriel Goh models momentum over at the new machine learning journal Distill. The…
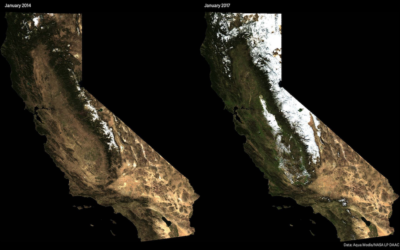
Shift in world’s night lights
NASA recently released composite images of the Earth at night based on 2016…
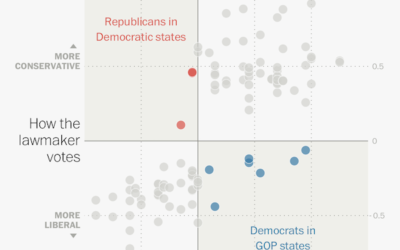
Senators and Reps whose voting doesn’t quite match the constituent’s
I know, it’s only April 2017, but some senators and representatives have some…
Finding the craft beer capital of America
You had me at craft beer. Russell Goldenberg for The Pudding looks for…
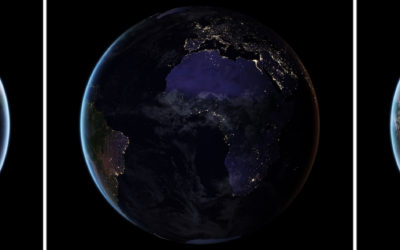
New images of Earth at night
NASA just released a composite map of the world at night using satellite…
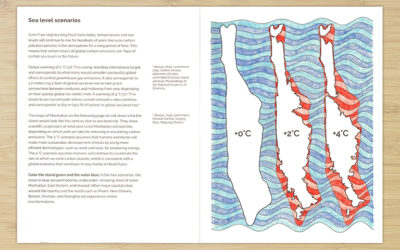
Climate Change Coloring Book
The Climate Change Coloring Book by Brian Foo makes data tactile and interactive.…