Network of statistical distributions
Feb 28, 2025

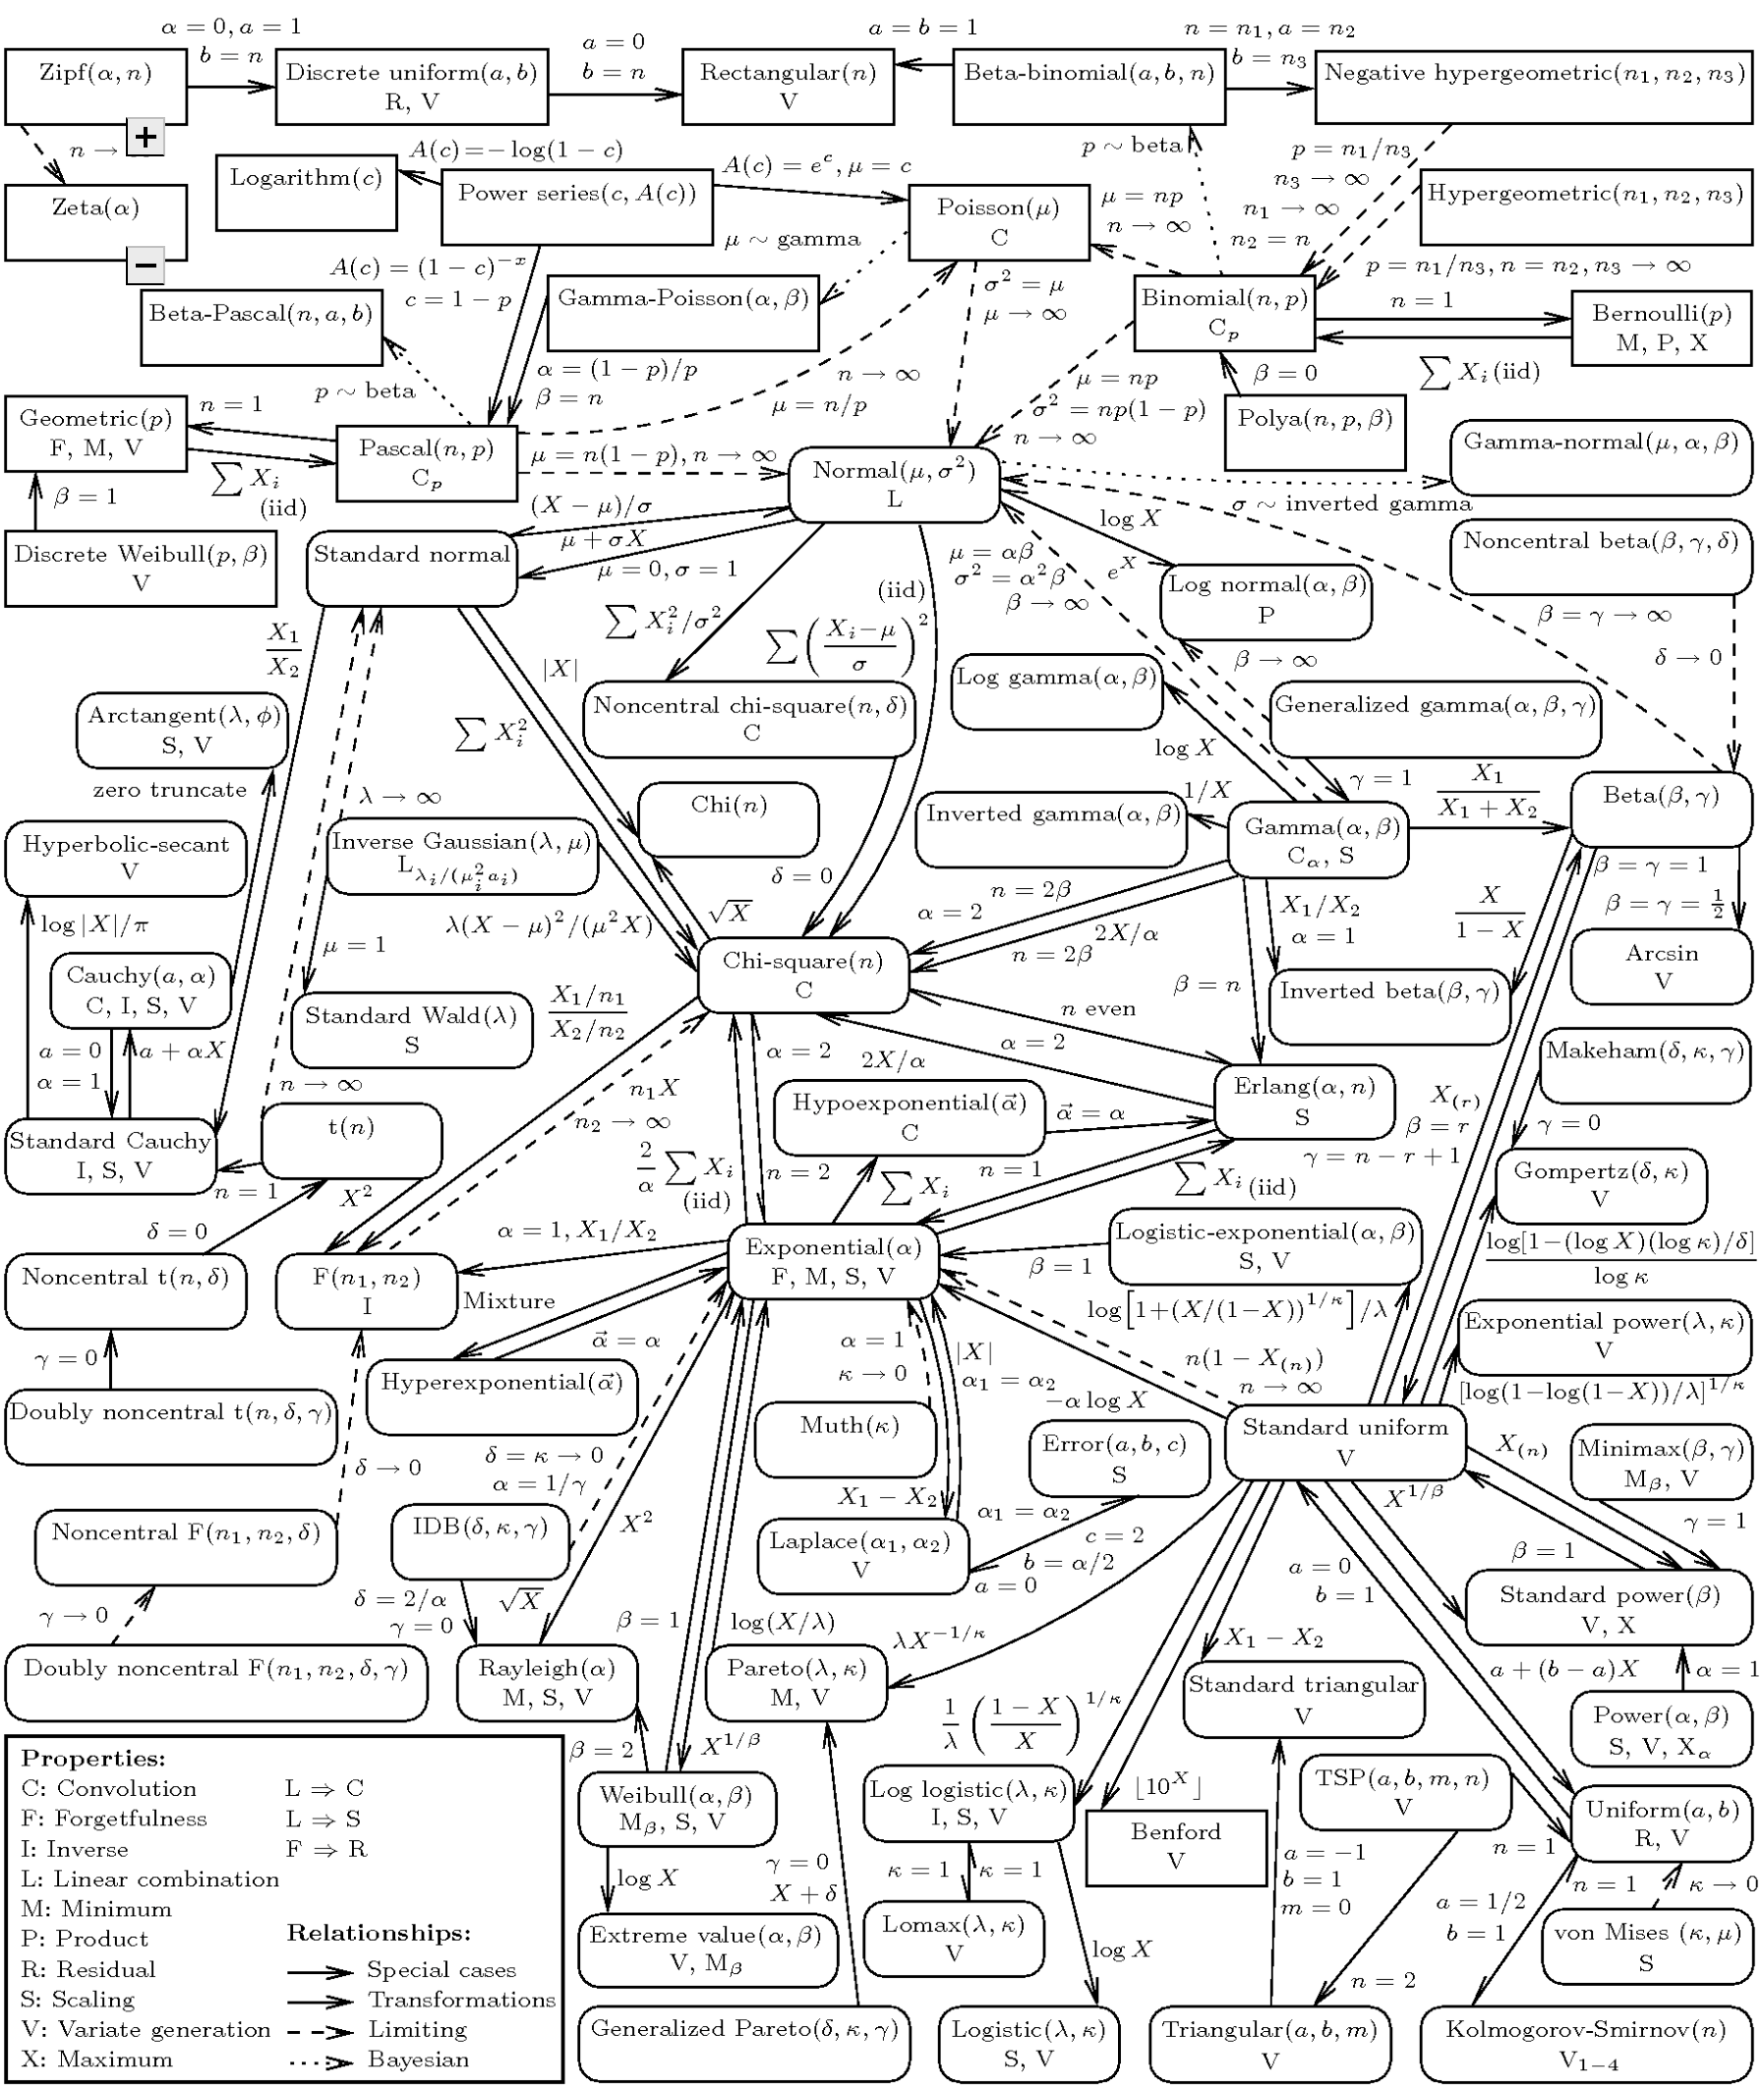
The network of 76 probability distributions show how they are connected:

Solid lines represent special cases and transformations from one distribution to another.

Dashed arrows are used for asymptotic relationships, typically as the limit as one or more parameters approach the boundary of the parameter space.

Dotted arrows represent Bayesian relationships.

Well, I guess that clears things up.

Become a member. Support an independent site. Make great charts.

See What You Get

Favorites

Seeing How Much We Ate Over the Years

How long will chicken reign supreme? Who wins between lemon and lime? Is nonfat ice cream really ice cream? Does grapefruit ever make a comeback? Find out in these charts.

When Americans Reach $100k in Savings

It was reported that 1 in 6 millennials have at least $100,000 saved. Is this right? It seems high. I looked at the data to find out and then at all of the age groups.

Watching the Growth of Walmart

The ever so popular Walmart growth map gets an update, and yes, it still looks like a wildfire. Sam’s Club follows soon after, although not nearly as vigorously.

Divorce Rates for Different Groups

We know when people usually get married. We know who never marries. Finally, it’s time to look at the other side: divorce and remarriage.