Waiting For a Table
It’s feeding time, your stomach grumbles, and if you don’t get something in your system soon, hunger will take over your civility. So you walk into a restaurant where there are a bunch of other people in line for a table. You ask the restaurant greeter how long the wait is.
“About 5 or 10 minutes.”
Uh huh. Five or ten minutes. Sure, you’ve heard that before, and then you end up waiting an hour just to get a table. Do you trust the estimate, or do you go off experience and head to the nearest fast food joint within walking distance?
Seinfeld party of four chose to wait and look what happened to them.
Here’s a better way to figure out how long you’ll have to wait until you’re seated.
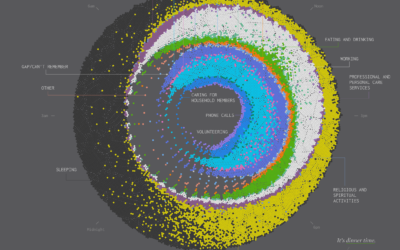
Below is an interactive simulation that takes into account how many tables are available that your party can sit at, the number of parties (that need the same size table as your party) ahead of you, and the average length of a meal at the restaurant (for your party size).
The simulation makes a few assumptions for the sake of simplicity.
Each iteration assumes that all the tables are occupied when you enter the restaurant, and the time until completion for each table is randomly distributed. I don’t have actual meal data, but I imagine time of day factors in here as more people roll in for lunch or dinner.
I also assume that meal time is normally distributed around the average you select. My guess is that’s not far from the truth, but again, I don’t know for sure.
That said, I think this still gives you a good idea of how long you’ll wait for a table.
Notes
- I used d3.js to implement this thing.
- For those who enjoy the pain of waiting, that real-time button is for you.
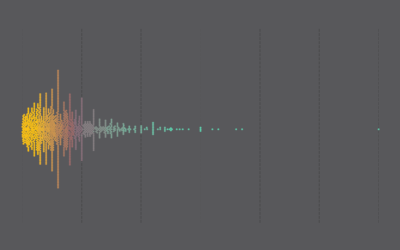
- The maximum for the rug chart represents waits that are two hours or more.
Chart Type Used

Become a member. Support an independent site. Get extra visualization goodness.
See What You Get