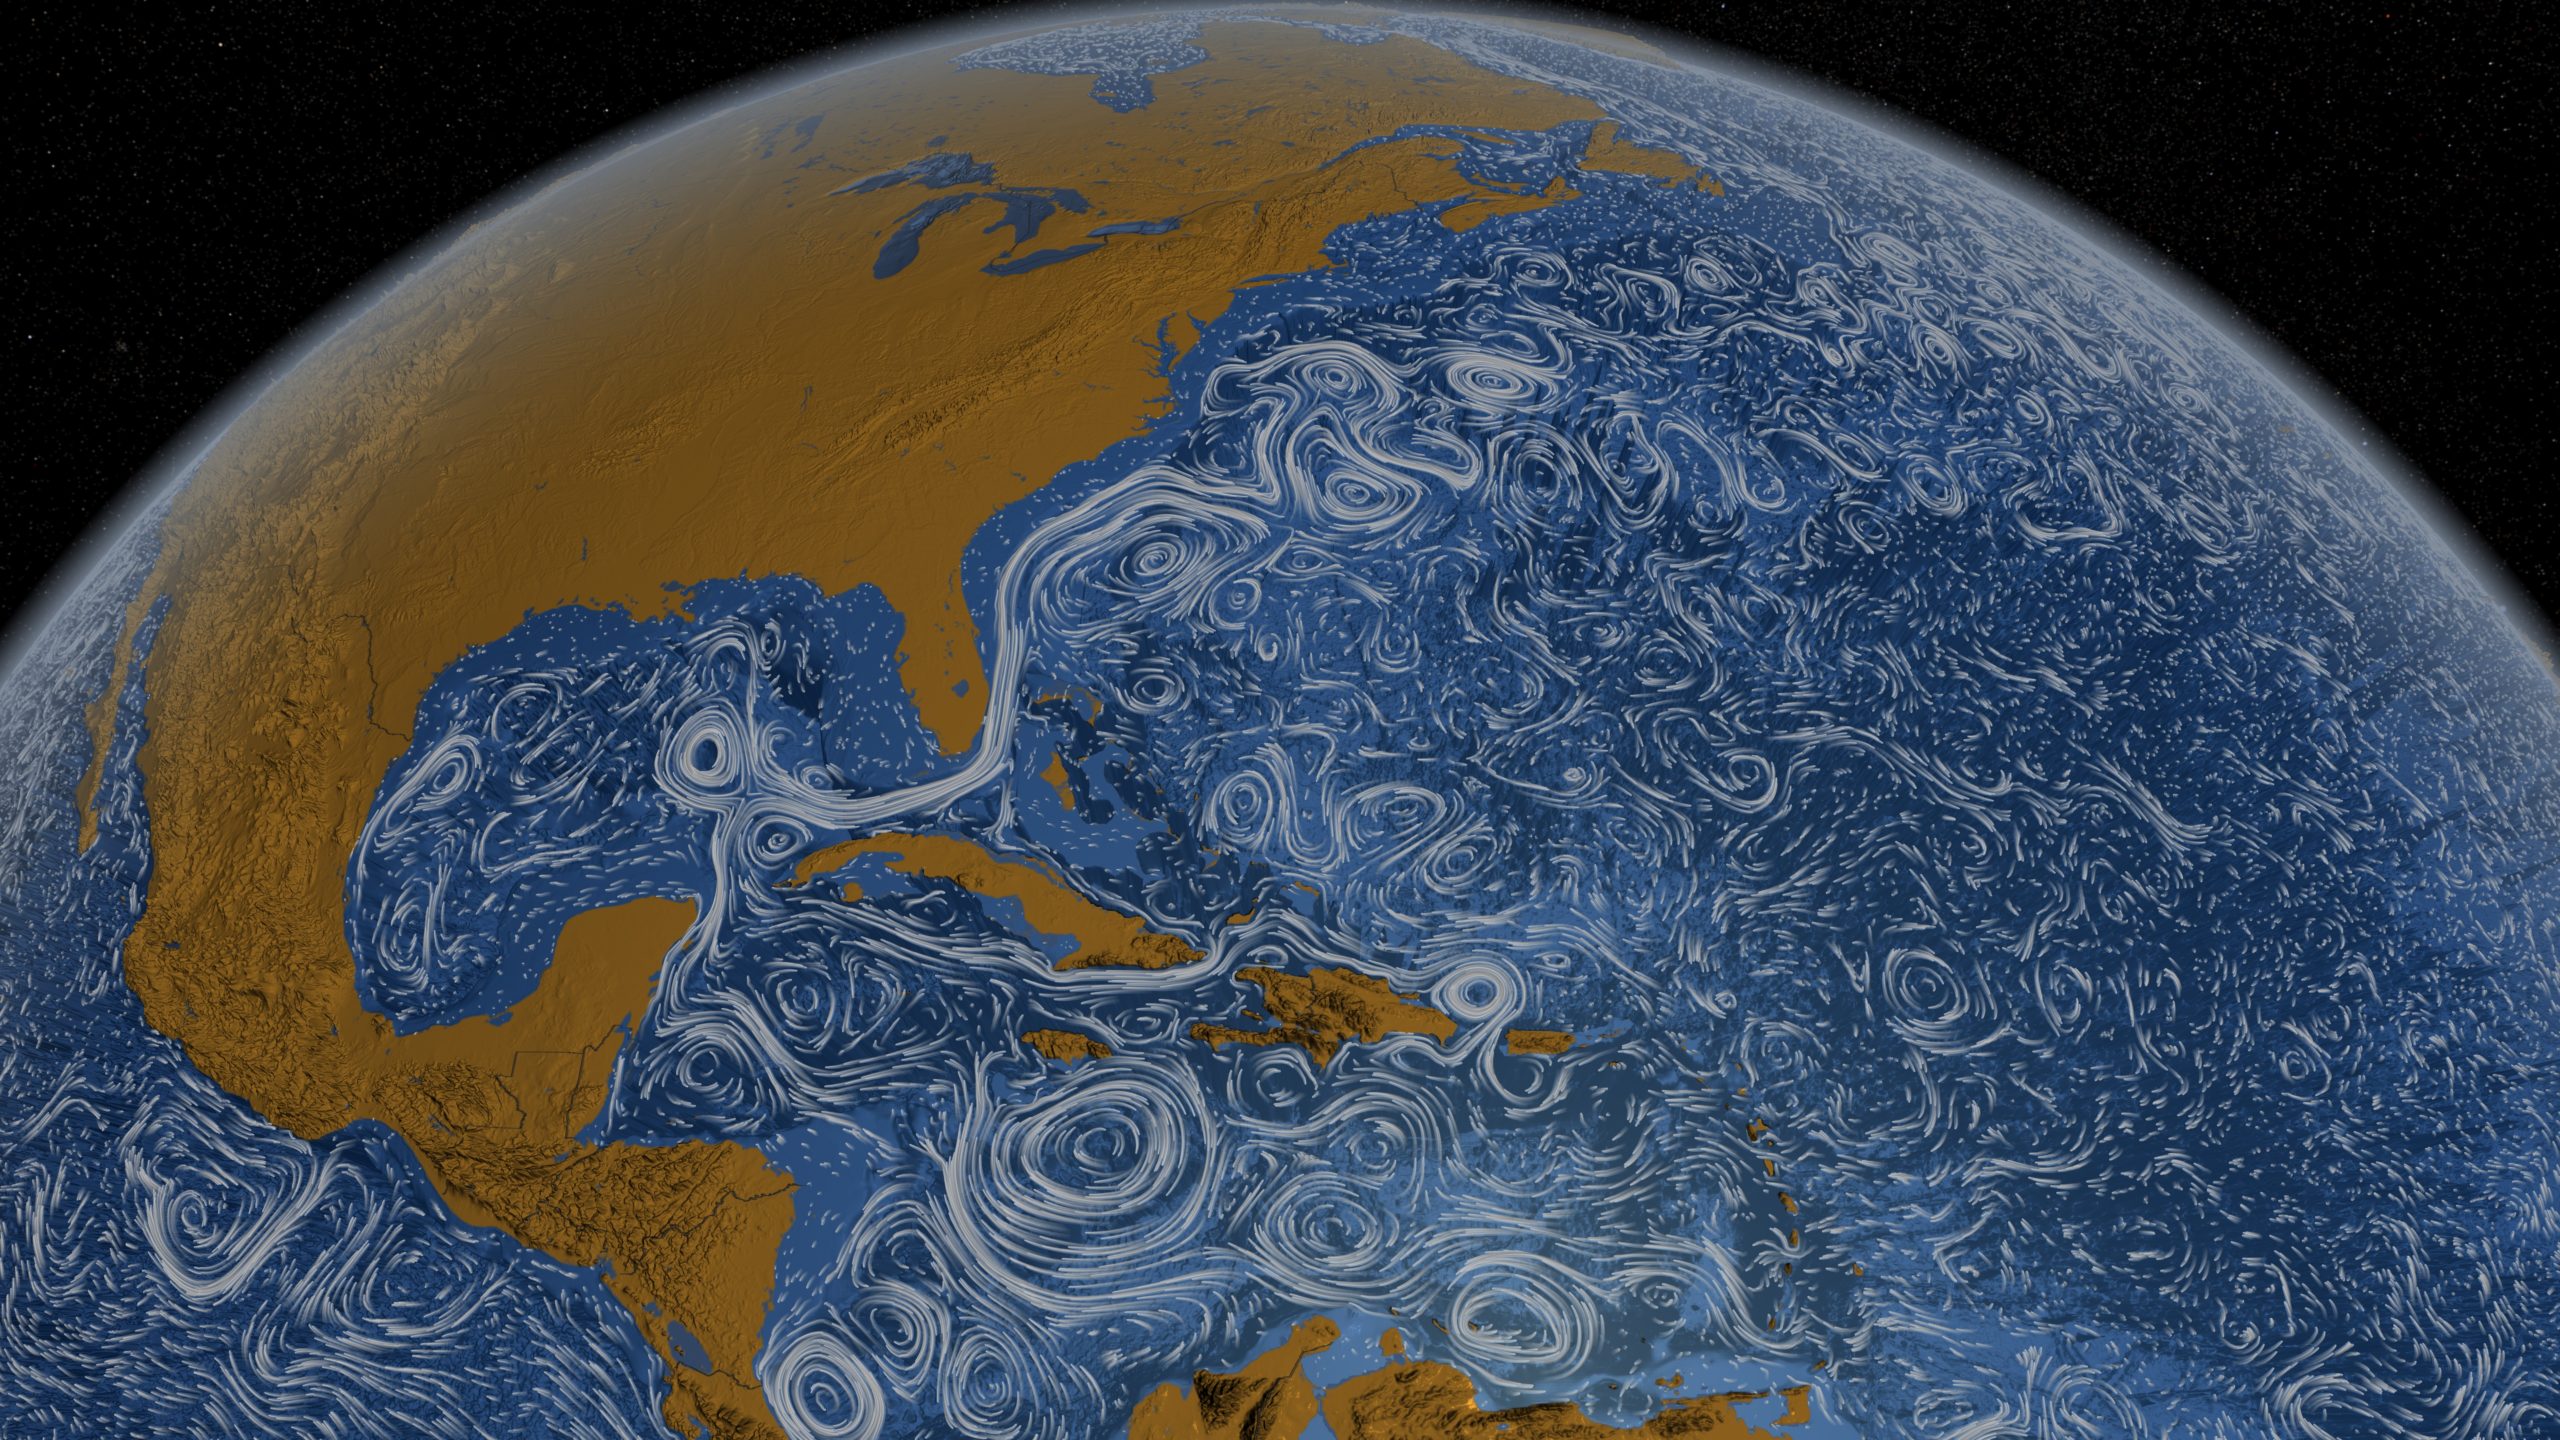
Perpetual Ocean

Mar 27, 2012

Using a computational model called Estimating the Circulation and Climate of the Ocean, Phase II (ECCO2), the NASA Goddard Space Flight Center Scientific Visualization Studio (I think NASA has a thing for long names.) visualizes surface currents around the world. This is beautiful science here. Make sure you turn on high-def and go full screen. [via @aaronkoblin]

Become a member. Support an independent site. Make great charts.

See What You Get

Favorites

Famous Movie Quotes as Charts

In celebration of their 100-year anniversary, the American Film Institute …

The Best Data Visualization Projects of 2011

I almost didn’t make a best-of list this year, but …

Data, R, and a 3-D Printer

We almost always look at data through a screen. It’s quick and good for exploration. So is there value in making data physical? I played around with a 3-D printer to find out.

A Day in the Life of Americans

I wanted to see how daily patterns emerge at the individual level and how a person’s entire day plays out. So I simulated 1,000 of them.