• September 17, 2025

    For the Washington Post, Taylor Telford, Jaclyn Peiser, and Federica Cocco report on job numbers, listings, and unemployment, which have not looked favorable for many over the past year.

    Hardly any corner of the economy is untouched by jobs cuts and slowdown: Employment in all goods-producing industries slumped in August, with the deepest losses coming from manufacturing and mining. The service sector was racked by steep layoffs in business and professional services and IT.

    My general feeling is that data folks have seen better days, which seems to be part of a broader trend. Hoping things start ticking in the other direction.

  • For Reuters, Mariano Zafra and Sudev Kiyada highlight the true size of Africa and use the opportunity to describe map projections with handy illustrations.

    You would think by now, after many maps, illustrations, and interactive graphics, we would have a better intuition for the pros and cons of different map projections. But then the African Union wouldn’t still need to campaign for anything other than the Mercator projection.
    Read More

  • September 16, 2025

    OpenAI released a study of how people are using their chatbot.

    Patterns of use can also be thought of in terms of Asking, Doing, and Expressing. About half of messages (49%) are “Asking,” a growing and highly rated category that shows people value ChatGPT most as an advisor rather than only for task completion. Doing (40% of usage, including about one third of use for work) encompasses task-oriented interactions such as drafting text, planning, or programming, where the model is enlisted to generate outputs or complete practical work. Expressing (11% of usage) captures uses that are neither asking nor doing, usually involving personal reflection, exploration, and play.

    A relatively small percentage is for programming and even less for data analysis. Writing and how-to queries take the majority, which I can only assume is mostly for LinkedIn posts.

  • This summer was supposed to be a return to pre-pandemic levels of movie-going, but that was not the case, as shown by Christine Zhang and Brooks Barnes for the New York Times.

    I’m into the movie poster as stacked bar geometry. Now do it with streamgraphs.

  • September 15, 2025

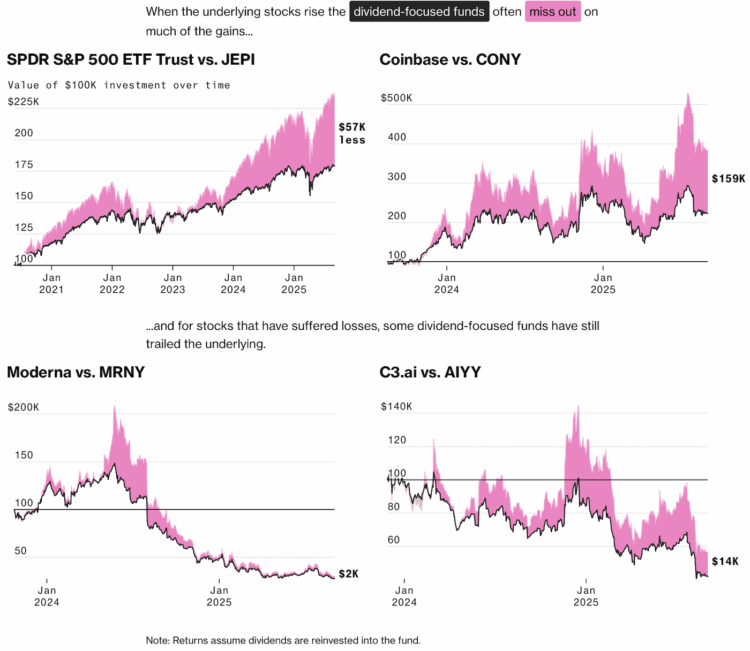
    There is a growing trend among investors to put money in places with high dividends. They prefer money now over decades from now. However, the higher dividends come at a cost in the longer term. For Bloomberg, Denitsa Tsekova and Vildana Hajric, with graphics by Armand Emamdjomeh, discuss the trade-offs that make the money-now approach seem less favorable.

    The current wave of interest is new enough — and many of the followers young enough — that it has been easy to ignore how the most popular funds have often lagged basic stock indexes and threaten to eat away at long-term returns. Samuel Hartzmark, a professor of finance at Boston College, has researched the issue for more than a decade and has found that investors tend to fall for the “free dividends fallacy,” treating them and capital gains as separate. A 2015 paper of his finds that investors prone to that bias have a preference for funds that report boosted dividends even if they don’t improve overall returns.

    There is a scrolling chart at the beginning that compares returns with different strategies over time. At first, I wasn’t fond of a non-zero baseline on an area chart, but technically it’s a difference chart with a baseline that indicates the starting investment. I guess I’ll let it slide.

  • September 12, 2025

    Bloomberg gained access to an email cache from Jeffrey Epstein’s Yahoo Mail inbox, spanning two decades between 2002 and 2022. They highlight the relationship between Epstein and Ghislaine Maxwell and how the timing and nature of the emails reflect a closer timeline than Maxwell has suggested.

    The cache also included a spreadsheet from Epstein’s accountant that lists gifts and payments, such as watches and massage lessons. Bloomberg charted three years of transactions with a bubble chart over time.

    It’s only a fraction of Epstein emails, as he used multiple addresses over decades, but it’s quite the digital trace. Find more on how Bloomberg verified and analyzed the cache here.

  • September 11, 2025

    This sight is growing too common in the United States. The New York Times shows an aerial view of where Kirk was and where the shooter is believed to have been. A Utah locator map appears in the top left to provide geography, and a north arrow on the bottom right sets orientation.

  • In case you’re trying to navigate from one star to another in the Star Wars galaxy, there is an official detailed map of the fictional space. It is not comprehensive, as apparently the galaxy “contains billions of stars and is home to trillions of beings” but it seems like it should at least be good enough to figure out which direction to go. (via kottke)

  • Members Only
  • For Quanta Magazine, Shalma Wegsman provides a history of Jean-Baptiste Joseph Fourier’s transform. James Cooley and John Tukey get a nod:

    Any 8-by-8 image, for example, can be built from some combination of the 64 building blocks [above]. A compression algorithm can then remove high-frequency information, which corresponds to small details, without drastically changing how the image looks to the human eye. This is how JPEGs compress complex images into much smaller amounts of data.

    In the 1960s, the mathematicians James Cooley and John Tukey came up with an algorithm that could perform a Fourier transform much more quickly — aptly called the fast Fourier transform. Since then, the Fourier transform has been implemented practically every time there is a signal to process. “It’s now a part of everyday life,” Greengard said.

    I’ve said this before, but this would’ve been useful for me in college. The two-hour lectures on Fourier transforms, after lunch and in the dark, were brutal and I might’ve missed a slide or twenty.