Work Cohorts

How many people in the United States have a high school education or less, earn more than $200,000 in salary, work 20 to 29 hours per week, and have a commute under 15 minutes? A couple thousand do, based on estimates from the most recent 2023 American Community Survey. Sign me up.
Better yet, let’s join the few thousand with no commute, working less than a quarter time, and earning more than $200,000. That sounds pretty good.
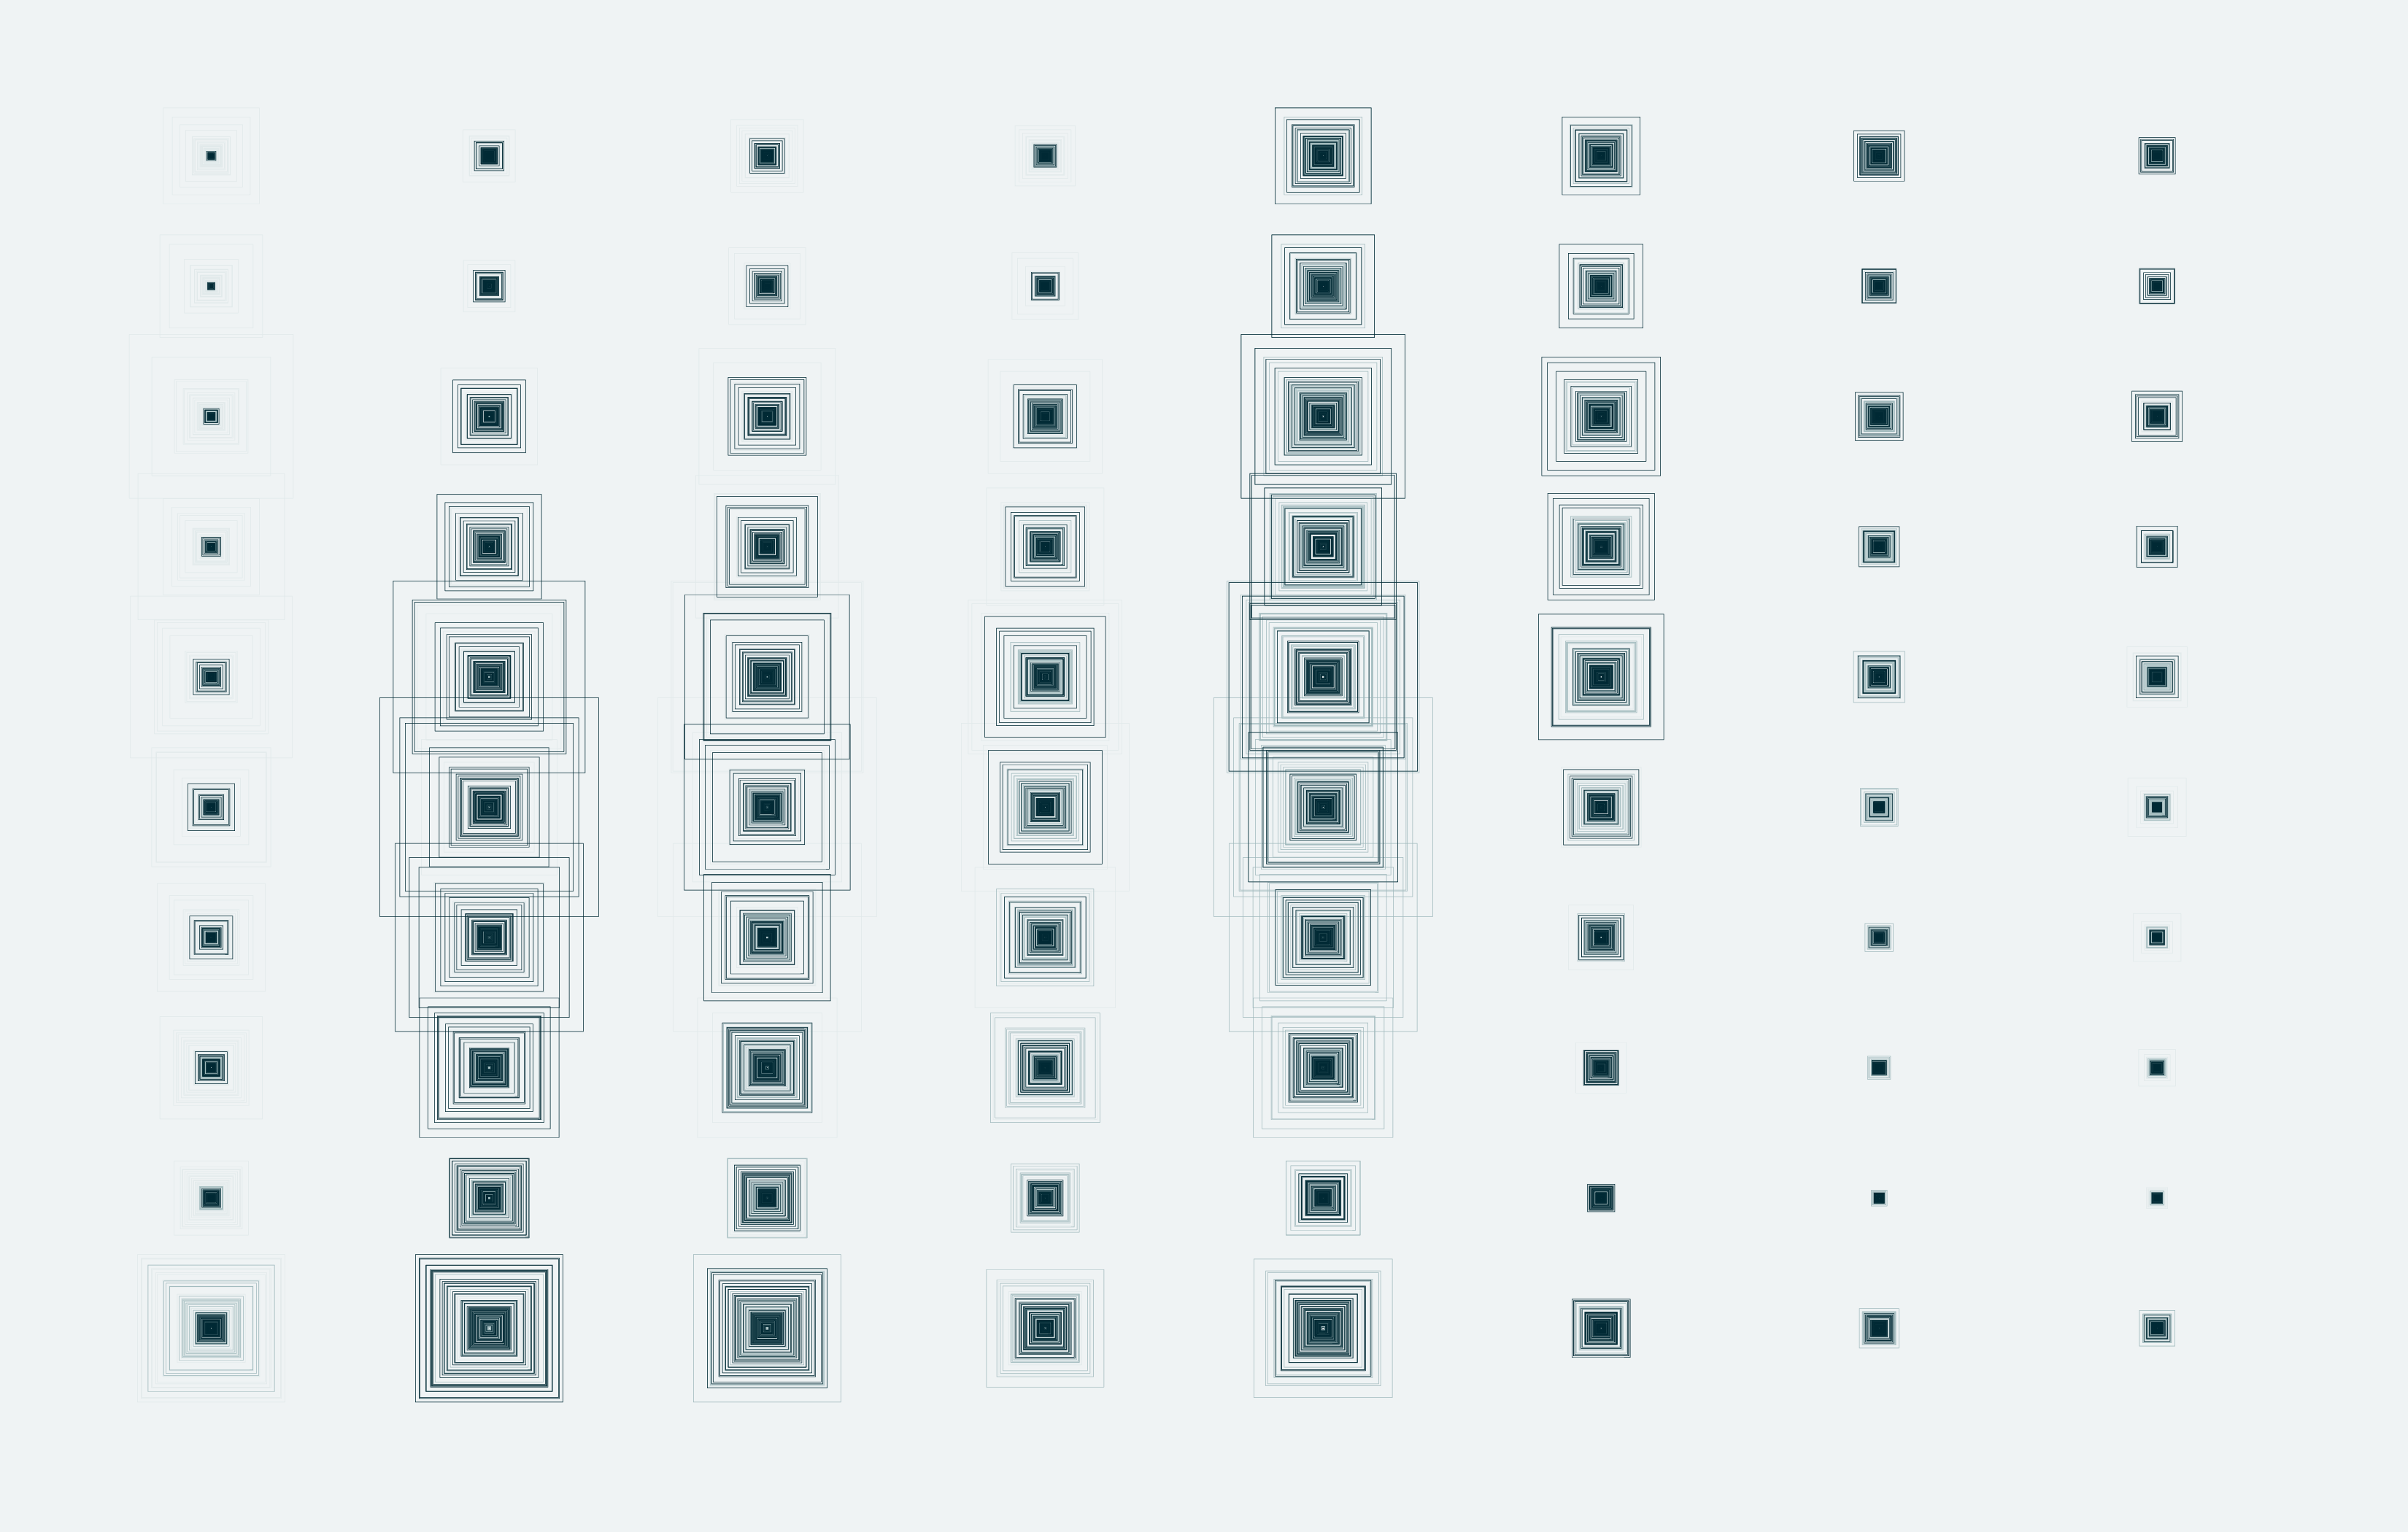
The graphic below shows the size of work cohorts, given education, annual income, weekly hours, and commute time to work.
People with the Same Education, Income, Work Hours, and Commute Time
Use the sliders to adjust demographics.
Those with a high school education, an annual income from $35,000 to $49,000, full-time hours, and 15- to 29-minute commute are in the most common cohort. The second most common are those with the same education, work hours, and commute, but the next income level up between $50,000 and $74,000.
There tend to be fewer options with less education, so it’s more likely that people fall into the above income brackets. In the chart below, which shows two demographics at a time, you can see counts increase in the higher income brackets for more education.
Group Comparison
Select from the menus to see the relationship between groups. Darker colors indicate more people.
Of course nothing is guaranteed. There are people with higher education levels, and lower income and people with lower education levels and higher income. Work hours and commute times look evenly distributed, regardless of income or education, which makes sense.
There’s a certain comfort in seeing counts fill in various groupings. In all likelihood, there are thousands and sometimes millions of others in same cohort.
Notes
The data comes from the recently released 2023 American Community Survey. I downloaded data via IPUMS and aggregated in R. The aggregates are estimates, as they’re based on sample data, so while the counts are fun, I’d focus more on the distributions.
Analyze, visualize, and communicate data usefully — beyond the defaults. Become a member →


