In the 2000s, if you wanted to make interactive or animated visualization for the web, Flash was the main option. When Flash lost support and fell off the internet, a solid decade of great visualization no longer worked.
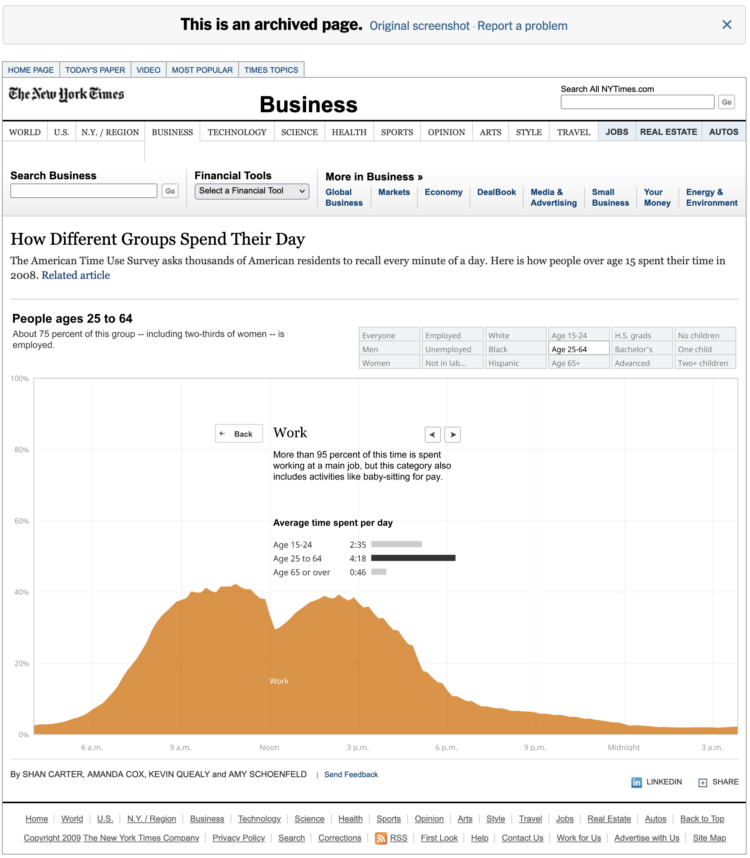
The New York Times has resurrected their archives with a Flash emulator. So pieces that were relegated to static thumbnail images are back. See the box office streamgraph that once upset many, the multi-line chart showing jobless rates for people like you, and the interactive stacked area chart on how people spend their day.
NYT is using the open source Ruffle as their Flash emulator. I hope other news outlets follow. It’s great to see my favorite visualizations working again. [via EagerEyes]
 Visualize This: The FlowingData Guide to Design, Visualization, and Statistics (2nd Edition)