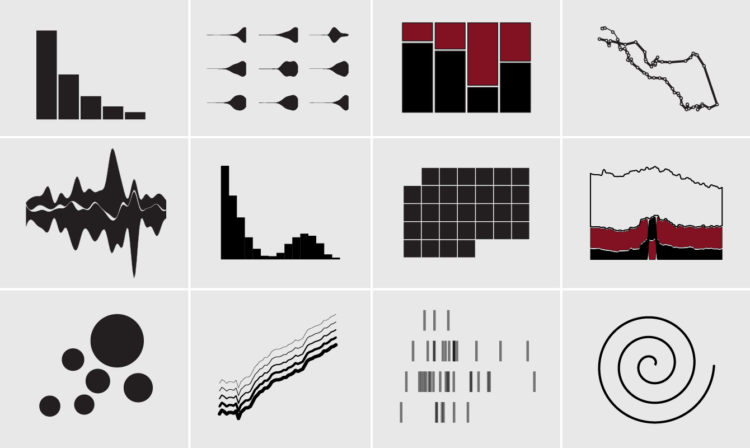
I have two course-related updates on FlowingData. First, there’s a new course on visualizing data with R. Second, I updated the Visualization for Clarity course so that you can more easily get feedback from me on how to make a better chart.
Members get instant access to the new courses. If you’re not a member yet, you can find information here.
If you’re already a member (thank you), log in and you can have at it.
Visualization in R

The first version that I wrote several years ago was an effort to consolidate my visualization tutorials so that those new to charts in R had a more step-by-step way to follow along.
This second version of the course is completely rewritten with new examples, exercises, quizzes, and resources all in one place. So it should be easier to follow along. You can also keep track of what you’ve completed and pick up where you left off. I hope it’s helpful.
Find more details on the Visualization in R course here.
Improving with feedback
I have another course, Visualization for Clarity, which is tool-independent. It’s more focused on making data graphics that help people understand data better than it is on the tools to work with data.
There are a few new wrinkles to this course. There are more exercises and resources. There are quizzes.
But the best part is that there’s a final project that you can send to me. If you send your project by November 30, 2022, I’ll send back comments on how I might make it better (or how great the work is).
When I was new to visualization, I made charts and stared at them for a while. I knew there was something to improve, but I wasn’t sure what it was, so I’d tinker a lot. Tinkering is time well-spent, but feedback from others helps with less random tinkering. I hope it’s helpful.
Find more details on Visualization for Clarity here.
Become a member
FlowingData is proudly 100% member-supported, and I’d like to keep it that way forever. If you’re not a member, I’d appreciate your support. You can see membership perks here.


