Cataloging All the Charts

Jul 15, 2020

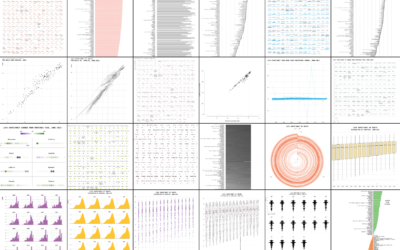
If you’re interested in a specific chart type, you can now browse FlowingData by all of the major ones. Find tutorials, guides, and examples for plenty of inspiration for the data you’re trying to visualize.

A few years ago, I added a new meta field to posts that indicated what kind of chart was used. I originally intended it as a way to make tutorials on FD easier to find and to categorize projects in some way. Then I started marking posts that served as a good examples of any given chart type.

I’ve been doing this off and on and adding new types as they come in. But I never made it obvious, and I don’t think many people noticed the extra field for some of the posts.

So it’s more obvious now. Browse all of the chart types so far.

Become a member. Support an independent site. Make great charts.

See What You Get

Favorites

Top Brewery Road Trip, Routed Algorithmically

There are a lot of great craft breweries in the United States, but there is only so much time. This is the computed best way to get to the top rated breweries and how to maximize the beer tasting experience. Every journey begins with a single sip.

Graphical perception – learn the fundamentals first

Before you dive into the advanced stuff – like just about everything in your life – you have to learn the fundamentals before you know when you can break the rules.

Interactive: When Do Americans Leave For Work?

We don’t all start our work days at the same time, despite what morning rush hour might have you think.

Seeing How Much We Ate Over the Years

How long will chicken reign supreme? Who wins between lemon and lime? Is nonfat ice cream really ice cream? Does grapefruit ever make a comeback? Find out in these charts.