How Airbnb Visitors Rate Location in Major US Cities

Through Airbnb, you can stay in other people’s homes, condos, and apartments, and at the end of your stay you get an email to rate your stay. There are six things they ask you about: the accuracy of the listing, communication, cleanliness, check-in experience, value, and the location.
Beñat Arregi focused on that last one, location, using it as a proxy to see how visitors see a city in different neighborhoods. In the maps you can see where the city centers end and pockets that might not be the best place to visit.
Arregi looked mostly at European cities though, and after seeing there was data available for more US cities from Inside Airbnb, how could I not take a look?
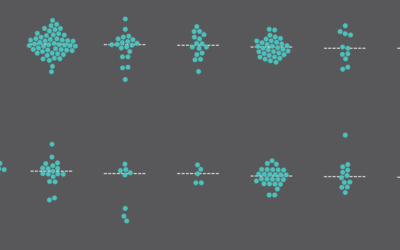
Below are the location ratings for listings in 16 major US cities. Click to embiggen.


I whipped these up pretty quick in R, mapping listings with non-anonymous locations. They’d likely benefit from some aggregation or hexbinning. There’s overlap in the densely populated cities, so some points are obscured. The listings with more reviews are placed on top.
Still though, I think it’s interesting to see the geographic patterns and the sudden shift in ratings.
You might think that the other ratings such as value or overall average correlate to the location rating, but the others actually look pretty random at first glance. I’d have to look more, but my hunch is that the cost goes down with the location rating, and then visitors typically adjust their expectations accordingly.
 Mapping Geographic Data in R
Make maps that allow you to see spatial patterns across regions and are great for presentation and communication.
Notes
- This is based on Beñat Arregi’s maps for mostly European cities. Worth a look.
- I made these maps in R. The scraped data from Inside Airbnb made the process much more straightforward than if I had to grab the data myself.
Chart Type Used

Become a member. Support an independent site. Get extra visualization goodness.
See What You Get