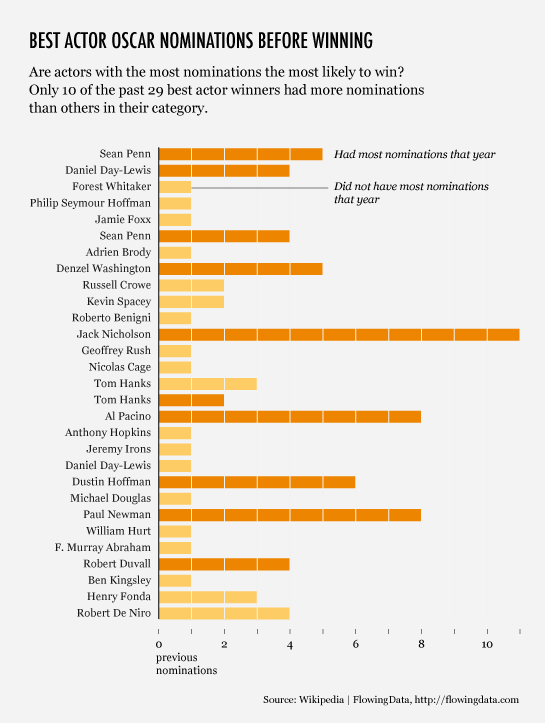
There’s this article on CNN, from The Frisky, that has this little theory about who is most likely to win the Oscar for best actor:
[T]he Oscar generally goes to the dude who has the most best actor and best supporting nominations under his belt already.
That seemed like a curious statement. Didn’t Forest Whitaker, Philip Seymour Hoffman, and Jaimie Foxx recently win on their first nominations for the coveted award? Okay, so Hoffman was actually up against a bunch of other newbies, but what about the rest?
Only 10 out of the past 29 winners, or just over a third, had the most nominations their year. Take a look at the data since 1980. Is the theory valid? You decide.
Of course when Jeff Bridges wins tonight, the theory authors will declare victory, but oh well.
Just for fun let’s take a poll:


Nathan,
Great question, but I read the theory and story a little differently. To me, I thought author was referring primarily to the total number of nominations received during their career. Although, she was not always clear about this. I wonder how looking at the total number of nominations received over time would change your results.
Jim
Whoops! I just reread the graphic and realized you already did this. The sentences at the top distracted me.
Well done!
Jim
Should the bars show the winner’s previous nomination count, less the count of the most-nominated (or next-most nominated, in 10 cases) contender?
@Tenzil – sure, that could be another way of doing it.
As always, it’s a nice visualization, but in this case I think it fails to communicate a key piece of information: the fact that in most years, there have been five nominees. So the probability of winning is about 1/5. But the chart indicates that the probability of winning conditional on having the most nominations in that year is 1/3; we should therefore consider this to be a piece of information in Jeff Bridges’s favor. The relationship is clearly not as strong as suggested in the CNN piece, but it’s there.
Matthew,
I think I reached your conclusion through a different path. As a univariate prediction model, the theory isn’t bad. In bivariate regression a 34% r-squared is decent. Sure, 66% of the outcome variability is explained by something else but you can’t cover the 66% by a single variable. All you’ve got is that one of the 5 or so nominees who did NOT have the most nominations won.
We could build a better model with more variables (exact number of nominees each year and the total number of prior nominations for each), but 34% isn’t bad for a single variable.
After trying to write that as clearly as I could, I think your conditional probability approach is cleaner (and easier to explain to my students).
I voted for the Jeff Bridges…he is “The Dude” for crying out loud!
Pingback: Is Jeff Bridges most likely to win best actor? « f.majakovskij