Axiis, an open source data visualization framework in Flex, was released a few days ago under an MIT license. I haven’t done much in Flex, but from what I hear, it’s relatively easy to pick up. You get a lot of bang out of a few lines of code. Axiis makes things even easier, and provides visualization outside the built in Flex graph packages.
Axiis gives developers the ability to expressively define their data visualizations through concise and intuitive markup. Axiis has been designed with a specific focus on elegant code, where your code can be just as beautiful as your visual output.
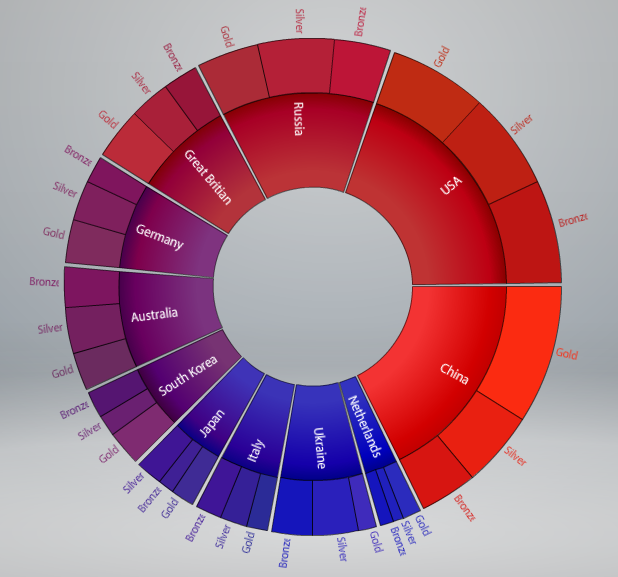
Above is the wedge stack graph. Here’s your standard area graphs:

See what other visualizations you can create with Axiis here.
Visualization Toolbox Continues to Grow
I remember when I was first getting into data visualization like all 3 years ago, and all I knew was Excel and R. My toolbox grew a little bit when I discovered this small PHP library called, oh I don’t know, sparklines or something like that. Fast forward to now, and we’ve got so much at our disposal in javascript, PHP, Python, Actionscript/Flash, Flex, Silverlight, Processing, and the list goes on and on. Data.gov just launched, Freebase is growing, infochimps is doing great work, and heavy computing resources are now available at low cost to individuals. I keep saying this, but this is exciting times for data. Seriously.
 Visualize This: The FlowingData Guide to Design, Visualization, and Statistics (2nd Edition)
any idea how it compares to berkeley’s flare?
I agree Nathan. I believe over the next several years Data Visualization will continue to grow as an industry and start to become as prevalent as the UX focus is today for building applications.
@d^2 – flare is an actionscript 3 library, so that’s a big difference. From what I hear, Flex isn’t as flexible than if you were to use actionscript, but Flex does require less code. Although again, I’m not a Flex user. I think it mostly comes down to a matter of preference between Flex and AS3
A couple of clarifiers here. Flex is an AS3 SDK, which allows for full OO/Procedural programming as well as application development with MXML, its markup language. You can use either/or in Flex. The advantage is Flex has a full GUI library in the SDK.
The biggest advantage in Flex (IMO) is that MXML supports automatic event driven binding. So your markup can be very concise and very dynamic, allowing you to do things in a much more intuitive manner (especially for graphical content) than you would in OO/Procedural code. Doing work work in both Processing and direct AS3, I find the markup approach to be more elegant and flexible for creating graphical assets.
Re, the difference between Axiis and Flare, is that Flare has a lot of focus on layouts and transitions, while Axiis is more focused on dynamic generation of composite/complex geometries and patterns. Flare is also all OO/Procedural, while Axiis is primarily Markup (but does support OO/Procedural.) Flare is also a lot more mature than Axiis. It probably comes down to personal preference and the specifics of your project.
Tom,
I know your link makes it clear, but you might want to mention in your comments that you are a founder of the Axiis project. Both as a disclaimer, and so that we can thank you for your work!
@BCC, Good point, Yes please read my comments above with the disclaimer that I am a founder of the Axiis project so my views and opinions may be biased :)
FYI, The AS3 Flare (ported from the Berkely Java version) project was used as some inspiration for Axiis, it is a very solid project and people have done some incredible work with it.
Also, there’s a critique of one of the top chart on this page over at the PTS blog…
@BCC PTS Blog? What is the URL, I always enjoy seeing critiques.
(BTW, the impetus to build that chart was based on the clients hard requirement of seeing data in a pie format, not because it was the most efficient visual to represent that data.)
Here is the blog post that talks about the requirements around a radial layout and actually points to (one of the few) benefits of using a radial scale that takes advantage of the PI*r^2 distortion caused in using wedge surface areas:
http://www.twgonzalez.com/blog/2009/03/new-visualization-stacked-wedge/
Pingback: System Advancements at the Monastery » Blog Archive » Setting Up Axiis for Security Visualization
Pingback: Whatever 25 May 2009 | PTS Blog
Pingback: de schoonheid van data |