Projects
Graphics by Nathan Yau, borne out of everyday curiosities, learning experiments, and mild insomnia.
Remote Workers vs. Non-Remote Workers
How the schedules between remote and non-remote workers differ during workdays.
Basketball Stat Cherry Picking
Wow your friends during the game with random win percentages, based on various player stats.
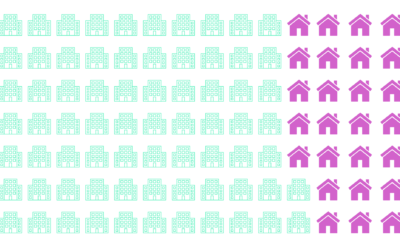
If We All Left to “Go Back Where We Came From”
Imagine that those with immigrants in their family tree left the country. Almost everyone, basically.

Data, R, and a 3-D Printer
We almost always look at data through a screen. It's quick and good for exploration. So is there value in making data physical? I played around with a 3-D printer to find out.
Visualizing Differences
Focus on finding or displaying contrasting points, and some visual methods are more helpful than others. A guide.

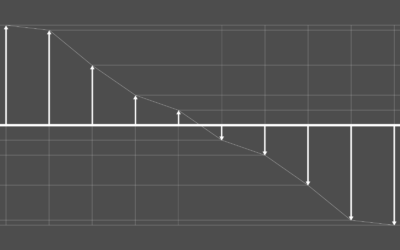
Most Common Occupation by Age
As we get older, job options shift — along with experience, education, and wear on our bodies.

Visualizing Outliers
Step 1: Figure out why the outlier exists in the first place. Step 2: Choose from these visualization options to show the outlier.
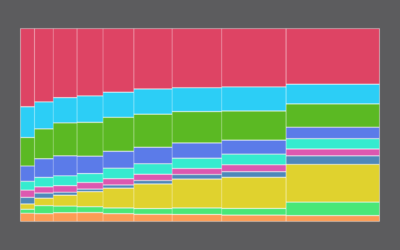
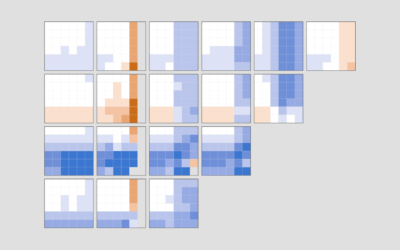
How Different Income Groups Spend Money
After living expenses, where does the money go, and how does it change when you have more cash available?

Visualizing Incomplete and Missing Data
We love complete and nicely formatted data. That's not what we get a lot of the time.
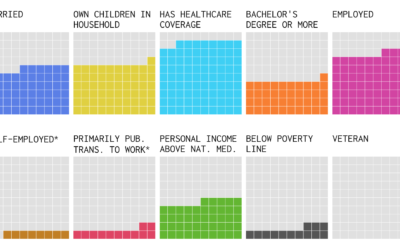
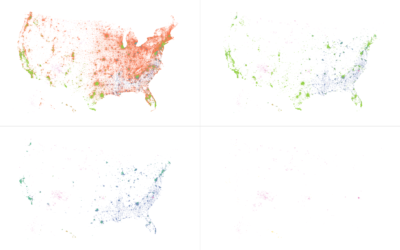
The Demographics of Others
I think we can all benefit from knowing a little more about others these days. This is a glimpse of how different groups live.
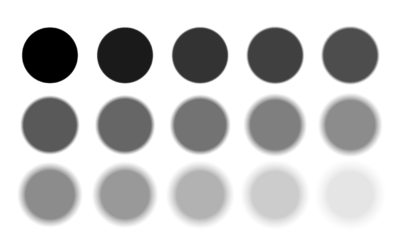
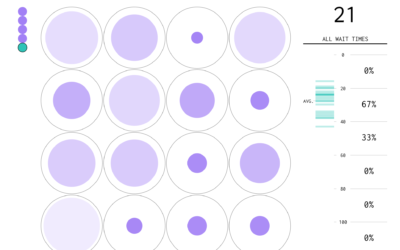
Visualizing the Uncertainty in Data
Data is an abstraction, and it's impossible to encapsulate everything it represents in real life. So there is uncertainty. Here are ways to visualize the uncertainty.
12 Days of ChaRt-mas
As everyone has already checked out for the rest of the year, I'm going to mess around with R to the tune of The Twelve Days of Christmas and nobody can stop me.