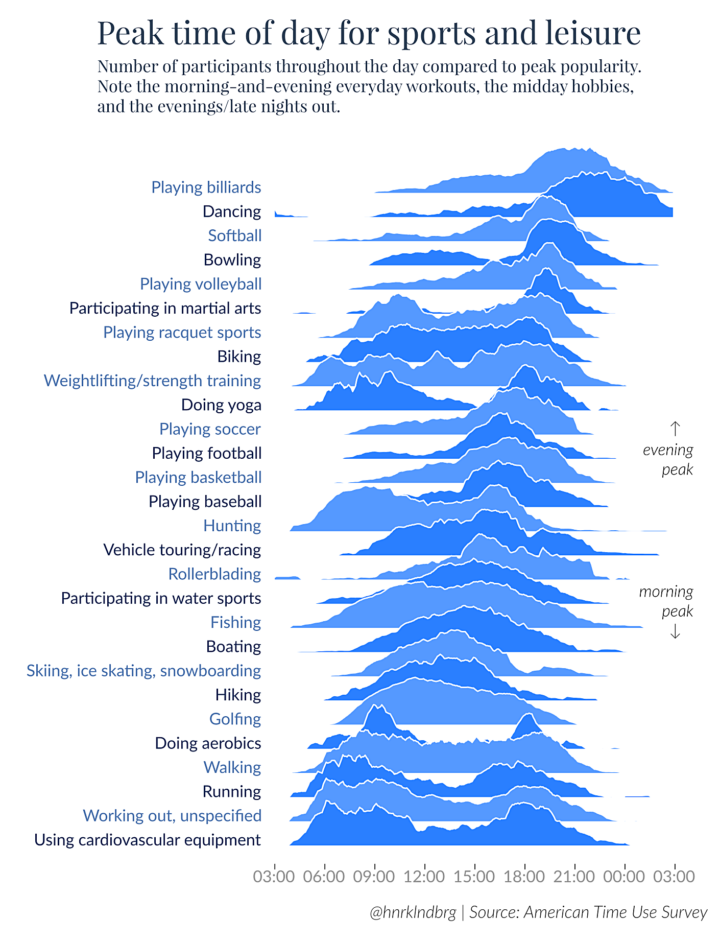
The American Time Use Survey asks people what they do during the day. Activities are split into categories. One of those is sports and leisure, which is further broken down into more specific things like biking and basketball. Henrik Lindberg charted the relative peak times for these subcategories using overlaid area charts.
Fun.
Lindberg made it in R, and you can grab the data and code here.

 Visualize This: The FlowingData Guide to Design, Visualization, and Statistics (2nd Edition)