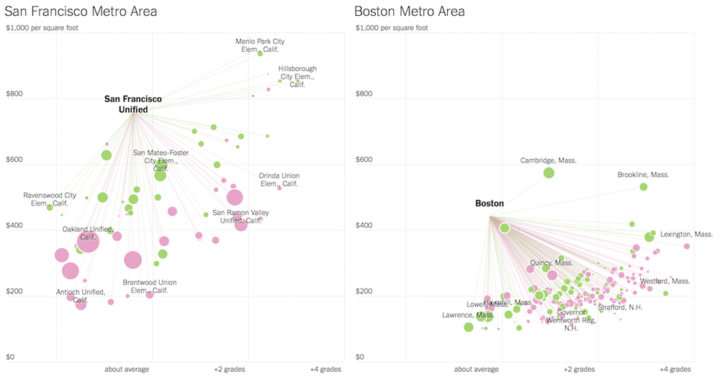
Families often move out of the city to the suburbs for more affordable housing (or more space) and better schools for the kids. Quoctrung Bui and Conor Dougherty for The Upshot plot these two things, average price per square foot and school district performance, to compare against the respective city.
In addition, there are two more encoded variables in each bubble. Size represents population, and color represents an average commute time of less than (green) or greater than 30 minutes (pink). On top of that, connecting lines focus comparison for suburbs against the main city school district.
So there’s a lot going on. My initial thought was that the charts showed one variable too much, but the more I stared, the more I liked what I saw.
You expect pink dots to venture bottom right, with average commute time as sort of a proxy for distance from the city. As the charts show it’s more complicated than that (as usual).
But the most surprising thing for me when I scrolled down, as someone living in a suburb of the Bay Area, was the big jump down from much lower housing prices in Chicago and Minneapolis. You’re looking kind of good Wayzata, Minnesota.

 Visualize This: The FlowingData Guide to Design, Visualization, and Statistics (2nd Edition)