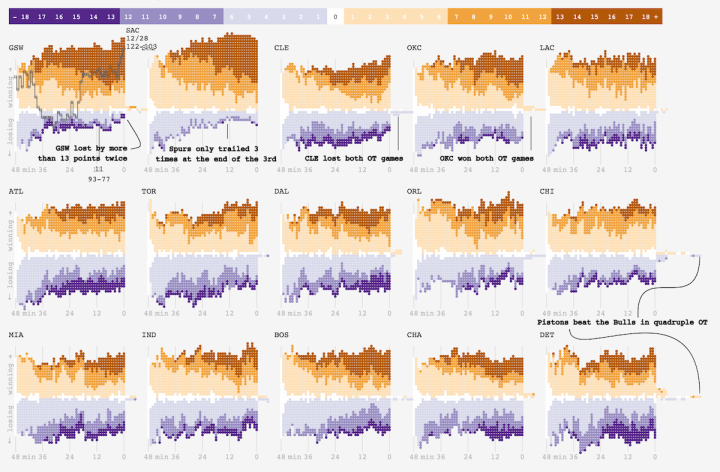
Adam Pearce charted minute-by-minute point differentials for NBA games during the 2014-15 season.
To squeeze distribution in, I had to make a couple of trade offs. Instead of being able to encode point differentials with vertical position like I did with my Golden State’s win streak chart, I used color for point difference and saved vertical position for distribution. Since there have been more score differences (GSW was beating by MEM 52 at one point) than can be usefully encoded as unique colors, I bucketed the score differences into 7 colors.
Nifty.
And go Warriors.

 Visualize This: The FlowingData Guide to Design, Visualization, and Statistics (2nd Edition)