John Nelson from IDV Solutions explains how he uses a Microsoft Excel hack to make geographic cell maps.
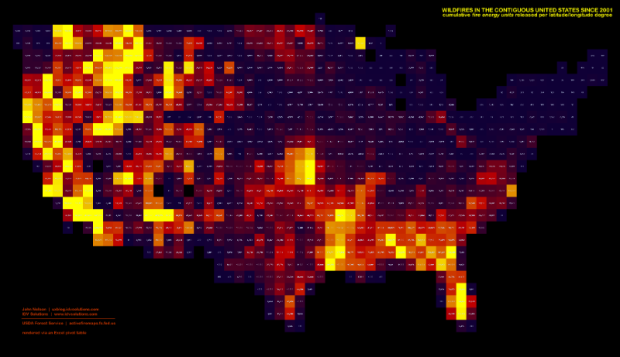
While pivoting data in Excel, it occurred to me that I could drag the latitude data into the row and the longitude data into the column. The result would be a 1980’s-Nintendo-looking chunky cell map (which, if I make the cells square, happens to be a pseudo-equirectangular projection). Low and behold.
It’s essentially four quick steps: Round latitude and longitude coordinates, bin them with a pivot table, reverse the order of said table, and color with conditions. You’ve got a rough overview map in a couple of minutes.
And once again, we see Excel provides flexibility to do some stuff. Like Excel paintings. [via @philogb]
 Visualize This: The FlowingData Guide to Design, Visualization, and Statistics (2nd Edition)