Annual Performance Review

I love my work. However, I miss out on great things as a self-employed individual, one of those things being the annual performance review. So, since this was the first full year dissertation-free, I reviewed myself. My boss is a jerk sometimes but a good guy for the most part.
Have a seat, Nathan. Let’s look at what you did for FlowingData this year and talk a bit about where we’re headed.
You posted 393 things in 2014. As usual, you highlighted the work of others and wrote monthly tutorials for our amazing members. But this was the first full year you didn’t have to work on your dissertation, and it looks like you used some of that time to work on more projects for FlowingData.
So… good news for you. It turns out that the most popular posts this year were all things that you did. Here are the top ten.
 1. Famous Movie Quotes as Charts
You finally completed the quotes list from the American Film Institute. We’ve been waiting three years for that, so thanks. Reaching millions, it was the most viewed and shared thing you made this year by far and almost ever, just barely outdone by the Wal-Mart growth map. We also got to make posters.
 2. Where People Run in Major Cities
These maps were way more popular than we anticipated. I guess a lot of people like to run. I’m more of a casual walker. Activity app Strava later made a more comprehensive map of runs and cycling.
 3. The Change My Son Brought, Seen Through Personal Data
Your son appears to guide much of your life these days, so it did not surprise us that you charted it. We were however surprised that the analysis amused many others.
 4. Jobs Charted by State and Salary
We’ve been telling you to learn more about d3.js. You played with d3.js before but finally got around to looking at the documentation closer. Good. In case you didn’t notice, your picks for best visualization projects of the year were all interactive or animated, and if you want to continue to thrive here, you will need to continue to learn.
 5. Chart of Cousins
You made this on a whim after a family gathering and seeing other charts were mostly cluttered HTML tables. Went for a million-plus views — but on a different site. Weird how that works. That said, we encourage work-family balance, so it’s good that you can find inspiration in your everyday.
 6. 19 Maps That Will Blow Your Mind and Change the Way You See the World. Top All-time. You Won’t Believe Your Eyes. Watch.
The title was questionable. Personally, my world view did not change and the maps didn’t seem like the top all-time. However, yes, I could not believe my eyes. I could not believe you posted such non-sensical gibberish. You even put in a section of lorem ipsum and just left it there. Oh, but awesome animated GIFs.
 7. Coffee Place Geography
Just like farting leads to pooping, a map of one thing leads to maps of other things. Be careful moving forward.
 8. Chart-Topping Songs as Graphs and Diagrams
Like the quotes, you made a few charts of Billboard songs years ago. Thank you for finishing the project.
 9. Burger Place Geography
Farting leads to pooping. We went over this already.
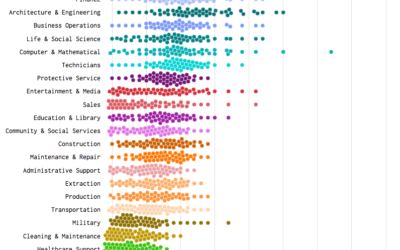
 10. Salaries by Occupation and Industry
Still digging into d3.js and BLS data, this one came about. Keep going with this. We like the start but you can do more.
Not a bad year for projects and posts. Remember to continue learning though.
I heard this talk by Eric Rodenbeck the other day, and he described what it’s been like to run a studio over the years. Wants change and technology changes, and if you don’t change with it, you become obsolete. That would be bad.
Again, interaction and animation in visualization are key next year. They provide opportunities for readers to explore data and interesting ways for us to communicate data to a wider audience. As you learn, write tutorials for how you achieve things so that others can learn alongside you.
However, don’t let pageviews completely guide what you work on. That would also be bad. The attention that you get for the pop culture-ish type stuff allows you to bring attention to things like that post you did on improving government data sites or that book Data Fluency that you tech edited. More of that would be good for next year, right?
Physical data is another focus for next year. We want to hit that topic hard as wearables and the Internet of things grows more mainstream and data interpretation moves away from the computer screen. There’s also a lot of untapped opportunity to do more with data than to make a few lights blink. Nothing against your Arduino tutorial, but that should just be the beginning. You knew that already though.
Speaking of physical, the higher ups mentioned your multivariate beer idea the other day. How do I say this? They think it’s stupid. I mean, to be honest, I don’t really get it either, but run with it. Just be sure to put out the more widely appreciated stuff, and you can get away with the niche projects. I mean, we want you to enjoy what you do, because the work suffers otherwise, so we’ll get you your hops and grains and whatever. Just don’t go overboard.
Any questions for me?
I didn’t think so. Why do you have that look of disdain on your face? I said I’d get you your hops. You want LEGOs too? What are you — 10? Okay, okay, we’ll get your LEGOs. Anything else?
No, that’s ridiculous. I don’t even know what you’d do with that, and it’d make the whole place smell like burnt paprika and melted rubber tires, mixed with sharp cheddar. Don’t ask me how I know what that smells like.
Alright, go on. Get out of here.
Thanks for your work this year, and I’m looking forward to what you have for us in 2015. Have a good new year’s and a good beer for me. I’m gonna turn in early or fall asleep on the couch around 10 waiting for the ball to drop.
Thanks everyone for reading and supporting FlowingData all these years. I’m grateful every day that this is what I get to do, and you make that possible. Here comes 2015.
Become a member. Support an independent site. Get extra visualization goodness.
See What You Get