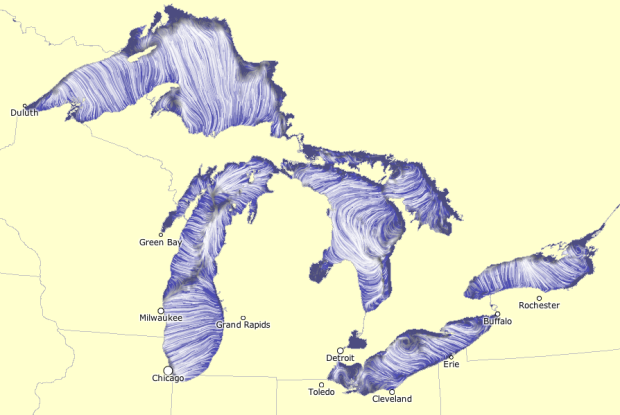
Using the same tech Martin Wattenberg and Fernanda Viegas created to show wind flow, the NOAA Great Lakes Environmental Research Laboratory mapped water flow in the Great Lakes, based on forecasting simulations.
The “Latest” and “3hrs Previous” visualizations depict water motion corresponding to a snapshot of lake currents at the present time and three hours previous to the present time. Lake currents can change rapidly with changing wind conditions.
Surface currents tend to follow the wind direction more closely than currents at depth. Depth-averaged currents represent the average water motion from surface to bottom and tend to follow shoreline and bottom contours.
The default map is semi-live, but you can also see flows for previous months. For example, the patterns during February 2011 are kinda cool, with a lot of swirling and well-defined currents.
 Visualize This: The FlowingData Guide to Design, Visualization, and Statistics (2nd Edition)
Apparently Canada no longer exists
Abundantly intriguing.