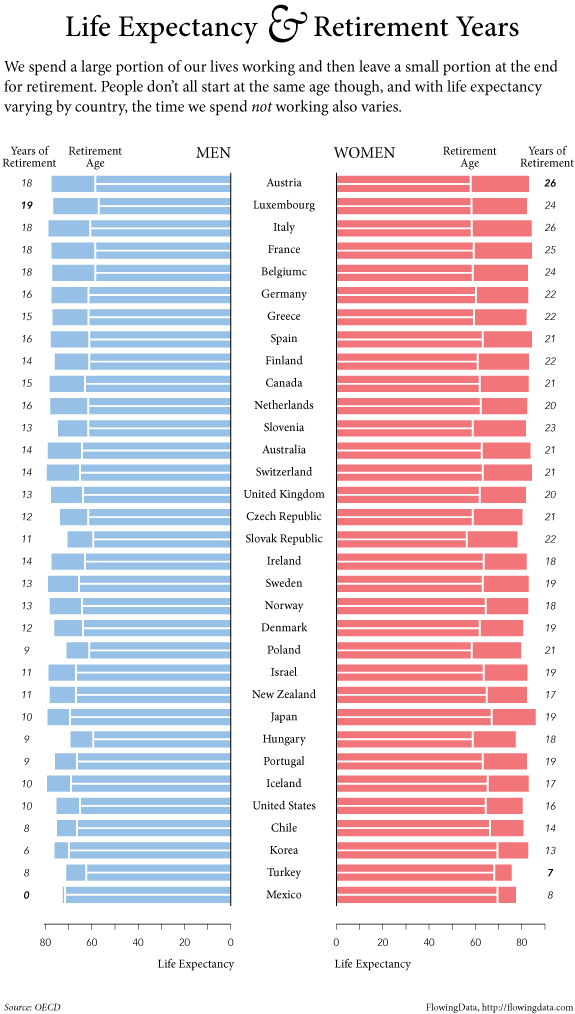
Early retirement. That’s what most people want, unless you’re lucky enough to love working. When you have the luxury of retiring early though, why not take advantage? According to OECD estimates for life expectancy and retirement ages, in countries like Mexico, it is common for men to work up to the last year of their lives. On the other hand, women in Austria spend an average of 26 years in retirement.
In the United States the average years in retirement is 10 years for men and 16 years for women (mostly because men typically die earlier)—among the least in the world.
When will you be retiring?
 Visualize This: The FlowingData Guide to Design, Visualization, and Statistics (2nd Edition)
Mexico men is an interesting case :)
In Russia people often die BEFORE they reach retirement age, especially men… Moreover, the retirement age has been increased recently… But tax rates are still growing…
People that reach the retirement age are likely to live longer than the expected life expectancy since that is calculated for the whole population. This means that the time spent in retirement is generally longer than what this chart shows. For example, in Sweden the life expectancy for a 65-year old woman is roughly 86 years while the overall life expectancy for women is 83 years.
Just to amplify on the comments, life expectancy increases throughout one’s entire life. So there’s one life expectancy at birth, which takes into account all possible causes of death, from infant death, to accidents, to suicides, to the natural death of “old age,” (which is not a medically recognized cause of death, by the way.) The older you get, the longer your life expectancy because you already have avoided dying younger.
So yes, to compare life expectancy at birth with retirement age gets the average length of retirement completely wrong. Completely.
To do this correctly, you need to get the data for the life expectancy at the age of retirement for every country, and then compare this to the retirement age.
As a quick check, I Googled life expectancy tables and came across this link from the social security administration. http://www.ssa.gov/oact/STATS/table4c6.html
It shows that the life expectancy of a U.S. man at age 65 is 17 more years, and a woman is 19.7 more years. So that would be a reasonable expectation for the average time spent in retirement which is 7 and 3.7 more years than is shown on the chart above.
As an interesting aside, funding for social security in the USA is such a problem because life expectancies have risen so much, and the law never contemplated this. So what was a sound funding mechanism in 1930 is now woefully inadequate.
life expectancy is different for what ever age you may be – the life expectancy for a new born child in the UK is different than for the child’s grandparent.
I would assume that these figures are the life expectancy for the people who are already retired – which means they can’t actually do anything to change their course!
Makes the graph a bit pointless – even if it looks nice and gets you a few hits!
I would not say useless. The impact is that most people don’t think about the global variation in lifespan, working ages, etc. If it illuminates that a bit, it works.
Sorry about the typo, you said “pointless.”
this is not a surprising fact.
You may want to check out this article:
http://faculty.kfupm.edu.sa/COE/gutub/English_Misc/Retire1.htm
The average number of years of retirement is NOT the difference between the average lifespan and the average retirement age since obviously some people die before reaching retirement age. Look at Mexico for example. The retirement age for men is equal to the life expectancy so the difference is zero, but that does not mean that there are no retired men in Mexico.
Sorry – this comment (and others) confuse me…
This is an effective average. Of course there are outliers in both directions, but the point of an average is to help see beyond the outliers.
If not this, how then, do you propose looking at how long people are retired by location?
This chart seems like a pretty reasonable approach to that question. The fact that the retirement number is zero in Mexico is exactly the point! Of course there are retired men in Mexico. But on *average* the duration of a man’s retirement is zero.
@Grib – Thanks. I think that just about sums it up.
Dan’s comment is correct. In the graph, people who die before retirement age are counted as having negative years in retirement, whereas they probably should be counted as 0.
Although that data might be hard to come by, so what they have probably gives the order of the countries fairly well, but all values are underestimates.
@JohnM – Do the methodology docs say that people who die before retirement are tallied as negative counts?
Nathan,
Thanks for prodding. On closer look, it looks like they do count death before retirement as 0 years in calculating average effective years of retirement. So I take back what I said.
If the chart used “life expectancy at birth” then the expected years of retirement can be negative, assuming they used “average effective age at which older workers withdraw from the labour force” as the link indicates.
I agree with Dan, David and Dave, you are putting together apples and oranges, although I disagree with the proposed fix. You really need to use the life expectancy conditional on entering the workforce – not the life expectancy at birth, and not life expectancy at 65.
Imagine an extreme population, where 90% of babies never make it, but the remaining 10% live to start work, retire at 50 and live to 100. Now life expectancy is 10 years and average retirement age is 50, based on the OECD methodology. Is the resulting -40 years an informative average?
I’d probably estimate the conditional expectation with life expectancy at 19-20 yrs old.
If some Mexican men are retired, then the average cannot possibly be zero. It makes no sense to include someone who has never retired in a calculation of average duration of retirement. Would you include people who died as infants in calculating this “negative” time period of retirement? How about miscarriages and abortions? Clearly not.
Again see my comment above. Mathematically, calculating averages is incredibly simple. But defining the problem, figuring out which numbers to use, and what to exclude, and whether to use an even weighting or not are where the skill comes in.
Counting some imaginary number into an average is not well-considered at best, and entirely misleading at worst.
It is not an average of all the retired people. It compares the life expectancy against the retirement age.
In Mexico, male retirement is a death penalty :).
Interesting data, but are the countries ordered in any logical way? Also, I know China has different mandatory retirement ages for men and women in certain sectors, with women being required to retire 5 years earlier than men. So that could also be a factor for some of these countries.
Yep – ordered by average between male and female.
Thanks for your reply, Nathan! The aggregate averages for the Luxembourg and Italy looked to be in the wrong order, but that’s probably due to rounding and such.
Sobering stuff if your planning on living the good life after you retire, especially if your a guy work from 20 to 60 and only live for less than another 20 years?!
Iceland comes quite low in for the men with just 10 years considering it has been in the top 5 of Men Life Expectancy for a long time, this is due to a high retirement age and general apathy to having nothing to do!
So. What this tells us is that retirement age for SS benefits should be 6 years higher for women than men in the US?
Hey, that’s a good idea. There is already a move equalize life insurance payouts – why not delay their benefits so they can earn them.
This week’s issue of The Economist (April 9 – 15, 2011) has a special report on pensions–the extent of the underfunding, to be precise. I find myself thinking that if our pension system cannot keep up when we are so far behind other countries, how much worse off we would be if we had that many more years of retirement to fund.
I’m late to the discussion here but I’m a bit puzzled why it seems you used life expectancy at birth as the statistic to compare with average age of retirement. Shouldn’t you use life expectancy at age of retirement. That would be complicated but a better picture would probably be given by life expectancy at age 65 which is in the OECD data. The choice of statistic will make a difference since for some countries relative high rates of infant mortality make a big difference to life expectancy at birth. The difference between the U.S and Austria would be decreased by two years as a result of changing the statistic. The difference between Mexico and Austria would be changed by about 4 years. The length of the expected retirement period would increase by something like 7 or 8 years for most countries. I think this would give an answer that fits better with what people have in mind in interpreting your question.
I agree with Dan, David Hilbert and a few others — it makes no sense to use life expectancy at birth to calculate years in retirement.
I didn’t find the OECD data for this, but the UN maintains a comparable database which gives life expectancy at 65. For Mexico, to take the most striking example, this is 16 years for men — not zero! — while for Austria, it is…16 years for men.
It is sadly risky to be an infant in Mexico, but for those fortunate enough to make it to retirement, there is no particular disadvantage relative to the developed world.
I like this! I have forwarded it to our analysts as a nice sample. The only change I’d try out (if it were mine) is to put the columns in order of life expectancy. Since life expectancy is a data point that is not actually shown numerically, it’s harder to compare. If they are in size order, they become easier to compare. Years of retirement, on the other hand, are easy to compare no matter what order they’re in because they are actual numbers.
As it is, life expectancy (and retirement age) is detracting from overall information comprehension because trying to read it visually is so difficult.
However, if the whole and entire point and frame you are creating is that XYZ on the top have a higher number of years of retirement than ABC on the bottom, then this is great, since the viewer can’t compare anything else.
What happens here in Mexico is that the generation on wich this data was based, is a generation were they think that if you are young, you better get to work! Kind of, if you work you are a man of good, if you work you find good in life, work till your hands bleed some old man said to me once, there’s nothing better than feeling tired for making a good job.
Different generations, different way of thinking and living. Plus, many of these people who work their entire lives do it out of need, many do it because they don’t know how to just relax and do nothing for the rest of the day, they need the money.
I’m 20 and I believe that working hard and happy all your life is the best way to enjoy it.
Guess I should stay in France then …
This chart is just one more reason why I plan to retire by 40 years old. Spending your whole life toiling away at work and trading your time for material possessions is not what I am on this planet for. I save 50%+ of my net income and invest the difference, to make sure that I retire young. Living frugally, saying no to material objects, and finding fulfillment in the little things in life is where it’s at. Save, save, save. Delayed gratification and patience are key if you ever want to stop the endless cycle of living to spend and working to earn. I’m no rat, and there is no trophy for winning the race!!!
I posted this outside my cubicle and it has stimulated many interesting conversations. I understand my co-workers perspectives on work and retirement a little better now. Reactions include, “i had no idea”, “i’m moving to europe”, and “…and that’s why my retirement plan is etc, etc…”
It also got me started thinking about my plan.
thank you and keep up the good work.
@Will – love this!
senior US male here. my retirement plan is to die at work.
i would like to claim tired_old_man’s extra 10 years which would give me 20… thereby putting me next to women from Netherlands. ;-)
In Russia people often die BEFORE they reach retirement age, especially men… Moreover, the retirement age has been increased recently… But tax rates are still growing…