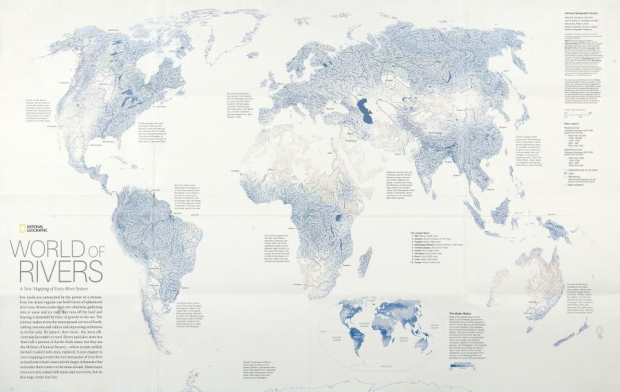
The annual Malofiej awards, for top graphics in journalism, were handed out last week. The best map of 2010 went to National Geographic for the World of Rivers. Every river system in the world was mapped and scaled by annual discharge.
We live on a planet covered by water, but more than 97 percent is salty, and nearly 2 percent is locked up in snow and ice. That leaves less than one percent to grow our crops, cool our power plants, and supply drinking and bathing water for households.
Showing everything doesn’t always work with so much data, but it does in this case. It reminds me of Ben Fry’s All Streets. See the full-sized interactive version on National Geographic.
Also, congratulations to National Geographic for winning the Peter Sullivan award (best in show) for their map of the oil spill in the Gulf of Mexico and The New York Times for their work on how Mariano Rivera dominates, print and online, respectively.


 Visualize This: The FlowingData Guide to Design, Visualization, and Statistics (2nd Edition)
Yikes! I tend to favor hockey over baseball, but that NYT sequence was stunning. Rivera’s control is hard to fathom. Hopefully the AL batting coaches are able to keep their players from seeing that…
Additionally, as a Colorado boy, it’s sad to see to the National Geo maps draw the Colorado River making it to all the way to the Gulf of California, when that hasn’t happened in quite some time…
Adam,
I shared the same concern you did about the Colorado River (living in San Diego, we’ve done a lot of graphics about water flow/supply). If it helps, the National Geographic map had this text next to the Colorado River label: “Carver of the Grand Canyon, the Colorado is one of the world’s most managed rivers. Its main stream and tributaries are dammed and diverted for use by seven U.S. states and Mexico, leaving its mouth dry in most years.” Good observation on your part, and one I was also looking at to see how NG handled.
I like.
I love that water map!
I’ve been tinkering with some interactive river maps myself (for the western US mostly), but I struggle to find long/lat (or similar) data for rivers. Anybody know of a source for such a thing? I’d love to get my hands on the underlying data for that NatGeo map.
Tried TIGER/Line? They have shapefiles for all water features in the US:
http://www.census.gov/cgi-bin/geo/shapefiles2010/main
oh – interesting… I’ll have a look – thanks much.
Also noticed that the NatGeo map has a source on it:
http://hydrosheds.cr.usgs.gov/
Haven’t looked yet, but appears to have downloadable content.
Will be interesting to see – I’ve found a few sources of vector data, but ultimately looking for long/lat data (just easier to work with in the context I have)
thanks again
Nice map from Nat Geo, but they miss a section in Central America, including the whole country of Belize. They have some interesting river systems.
For us data/visualization nerds, National Geographic is a must-read. They have a very talented mapping and visualization department and every issue contains at least 3 or 4 full page data maps or other interesting visualizations. I even started cutting out my favorite ones and creating a scrap-book. (super nerdy)