Lori Montgomery of the The Washington Post reports on the difference between the Democratic and Republican tax plans.
The Republicans’ plan to extend the Bush administration tax cuts for the wealthy would cost $36.6 billion more than the Democrats’ plan, which extends cuts only for families making less than $250,000 a year and individuals making less than $200,000.
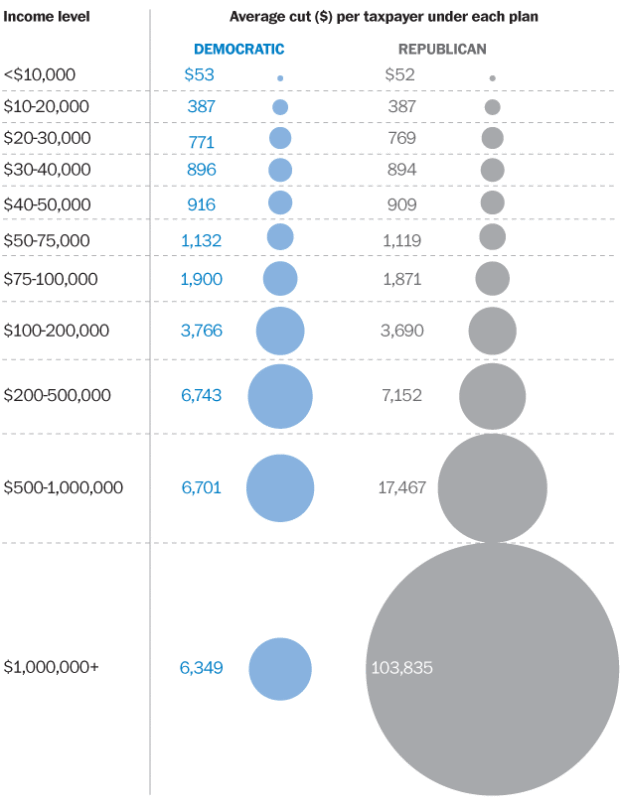
As you move down the chart, there are relatively small differences, until you hit the bottom. Medium circle. Huge circle.
And while we’re on the topic of telling stories with data, here’s Rachel Maddow providing an interesting explanation of what we’re seeing, along with some context.
[Washington Post | Thanks, Ed]
 Visualize This: The FlowingData Guide to Design, Visualization, and Statistics (2nd Edition)
These circles don’t mean a thing with out knowing what the original amount of tax they paid was
my parents are in the $200k to $500k range and and $7k is nothing compared to what they pay in taxes, its almost 50%
And half of 200K is 100K — which is still puts your parents in the wealthy income to live on category. 50% isn’t a hardship by any means in that bracket.
So taxes are appropriate at any level up until the point where they cause actual financial hardship? You might want to consider that people loose interest in earning more money if it all gets confiscated by the tax man. That’s not so good for the economy.
markr, actually quite the contrary — when taxes are higher, people work more so they can take home more. Not that I’m recommending harsh taxes or anything. Just being real.
Ryan is correct. It is important to represent a “reduction” in the context of what is paid. I’d like a parallel graphic with the remaining taxes paid at each income level.
Hello……$100K IS NOT WEALTHY (any more)
Not sure how they’re doing that. The highest tax bracket is 35%.
Or are you saying they only pay $14k, and the $7k they get back amounts to 50% of what they pay? I would LOVE to know how that works. So would the IRS, I suspect.
First, if your parents make that kind of money and pay 50% in taxes they are financial planning idiots. There are numerous legal ways for them to reduce their tax burden.
Second. for your parents the difference between the democratic and republican plans is minimal. It’s the super-rich who will be laughing all the way to the bank under the republican plan.
Totally agree
agree!
No offense, but no, your parents are not paying 50% in taxes. That’s a bogus figure you just made up on the spot. How exactly are they paying 50% of their income in taxes? The Top MARGINAL rate is 35% and that does not hit until you are the in $300K bracket.
According to fed income tax guidelines, if your parents make 200 – 500K, they are only paying 30-35% in taxes.
35% Bracket + Self Employment “Tax” =42% and then there is the FICA (fed) and Unemployment taxes (state) – damn close to 50% tax rate for those self-employed, just to put that in perspective.
There are at least three ways in which this chart implicitly favors the Democrat’s plan–which is also the Post writer’s preferred plan:
1) Reporting the differences as raw dollars rather than as a share of taxable income. That choice conceals the inherent progressiveness of both proposals while adding nothing.
2) Arbitrarily stopping the income categories at $1 million. I see a few approaches to this scale that would work much better: using the cut points of our actual income tax brackets; dividing taxpayers into equally-sized income deciles/quintiles; or simply adding $1 – $10 million, $10 – $100 million and $100 million plus categories. As it stands, the millions of dollars that a billionaire pays in taxes are grossly inflating the top category and making it appear that a mere million-dollar-earner is getting a $100k annual from the Republicans. Any alternative would be more honest; this is especially pernicious when combined with (1), because, again it makes the differences appear vastly more regressive than they are.
3) Treating these tax proposals as “cuts from the hypothetical 2011 baseline” rather than “increases from current 2010 taxes.” I see this as unfair: both sides have been committed to a departure from the hypothetical 2011 scenario for a while. Why use a near-impossible hypothetical rather than things-as-they-actually-are-today?
(3) is becoming a bit of a favorite toy for policy influencers who want to show illusory “savings” in their preferred tax expenditures and outlays through “unbiased” bean-counting departments like the CBO–like the PPACA getting serious credit for not-gonna-happen “savings” based on an impossible, drastic cut to Medicare reimbursements to caregivers.
What this infographic fails to show is the difference between where the money goes between the two plans. Look at the last bubbles. It looks like the rich are not paying their “fair” share. But where does the money go in the Republican plan. It goes toward capital investments in businesses, it goes toward spending on homes, televisions, remodeling, and on and on and on. Which is going to be better for the economy?
Yes, except for the part where NONE OF THIS HAPPENS IN REALITY! Sure, it sounds great in theory, and if it EVER happened even a little bit over the course of American history, I might go along with the notion that taxing the rich less means they’ll invest in society more. IT SIMPLY DOESN’T HAPPEN! Instead, the rich do what they do best; hoard their money away so that only THEY benefit from their fortune (which more-and-more come form ill-gotten or dubious gains). Amazingly, when you actually raise the tax rate to Clinton levels for the rich (which is STILL a substantial amount less then what they paid decades ago), the economy skyrockets due to the ability for the government to spend more on its people. When Bush came into the White House and cut off this revenue stream, it was the beginning of the end for fairness and common sense in this country. The worst part is, 98% of this country is filled with people in the middle and lower class that would only benefit from higher taxes for the rich, yet the percentage of the 98% that are Republican would rather cut off their noses to spite their faces then allow the wealthy that couldn’t give a crap about them to have to pay their fair share of taxes. THIS COUNTRY WAS FOUNDED ON FAIR TAXES, AND THE REPUBLICANS WIPE THEIR ASSES WITH OUR NATIONS PRIDE AND HISTORY!!!
What do you mean by “hoard money?” I don’t think you mean Scrooge McDuck room full of coins? If the rich are sitting on cash, they deposit it in banks where it can be loaned to people who need it to start a business. What you call hoarding the rest of the world calls capital formation.
Also the nation had relatively few taxes at the time of it founding, and certainly no income tax. I would prefer the tyranny of King George where no colonist paid more than 3% of their wealth in taxes annually than the system we have now.
I agree with JZ, except for the part about King George.
This meme of “THE COUNTRY WAS FOUNDED ON X” in most forms needs a history lesson.
The first federal income tax was raised in 1861 to pay for (you guessed it) war. 3% on incomes of more than $800 and 5% for incomes over $10k [1]. So for almost a century since founding, there was no income tax.
Unless by “founded on fair taxes” you mean no income taxes for anyone, then you’re right. But I don’t think that’s what you meant.
Secondly, I think you have a gross misunderstanding of what happens to the money that is “hoarded by the rich” (and the middle classes and poor if they can). That money is lent out or invested to create new business, build houses and expand the productive capacity of the economy (i.e. it creates jobs). So in fact it is not just “THEY” who benefit from capital accumulation.
Now, the issue of inequality is a different debate, and worth having, but get your facts straight before trying to address it.
[1] http://en.wikipedia.org/wiki/Taxation_in_the_United_States#History
Given the state of the economy as a result of having these tax cuts in place lo the last decade, I’d say the wealthy have done eff-all with their tax break to benefit the economy.
Andrew, please show your evidence that tax cuts will all go towards capital investments in businesses.
Hehe.
People who had a lot of money, a few million, say, had plenty in the stock market. When Obama took office in 2008, the stock market was at around 8000. Today, the stock market is around 11000. Anyone who was wealthy then, is more wealthy now to percentage gains far, far in excess of the extra 4% taxes they’d pay if Bush era cuts expired.
And yet, despite this very large gain in wealth, we have seen no increase in jobs. If another 4% of tax cuts not going away is going to create jobs, how come a real increase of 30% of stock based wealth hasn’t done anything to create jobs?
Dream on.
The myth of trickle down economics was busted in the 80’s. Doing the same thing and expecting a different result has a name, its called insanity.
Like QE2?
@JAZ — yes, it’s shown in raw dollars for a reason. We talk about the percentages all the time without seeing what they mean in actual dollars, so I find this refreshing. It’s also useful to show that there’s still an actual dollar amount savings for those at the top of the income scale, it just caps.
Also, let’s keep in mind that these taxes are based on taxable income, and people making upward of $250K will have accountants who can suggest ways to lower their taxable income more effectively than people trying to figure out how to do that on their own (my dad, a small business owner, absolutely had that conversation with his accountant regularly).
This is about making the difference in the plans clear, and in my mind it’s a pretty clear and effective graphic.
Thanks, JAZ, for saving me time by already saying everything I was going to point out! :)
@ Andrew MIlton — studies show that the middle and lower class will spend their tax breaks on goods and services, but the rich will save theirs. Thus the upper class tax cuts are the least efficient stimulus on the list.
Re: LaneT
I never cease to be amused at the circular logic of that argument: we need to increase taxes on the rich because they aren’t paying their “fair share”. And it’s ethically OK to do so because the rich can find ways to avoid paying those increased taxes…
I’m pointing out that it’s harder to get a “fair share” from the upper class. When you look at the dollars you will get, it is a percentage of taxable income not total income. Taxable income is a lower percentage of total income for upper class taxpayers than for middle class taxpayers. That’s not circular, it’s pointing out one more reason I have no time for people whining about the supposed pain of paying their “fair share. “
@LaneT
“the middle and lower class will spend their tax breaks on goods and services, but the rich will save theirs”
I think what you meant to say is that the rich will *invest* theirs. And investment, broadly speaking, is even better for the economy that the spending which the less wealthy may or may do after paying off their credit card balances.
Regardless, I agree fully with Jaz that this is a perniciously conceived graphic, not meant to illuminate the data but designed to lead the viewer, falsely, toward a certain conclusion.
Those idiots liberals should learn that is not their money or government money. It belongs to who produce.
That which is taxed does not belong to those who produce. Living in a society brings obligations with it, and if you detest these obligations so much, move.
“That which is taxed”, i.e., the tax rate, is not a presupposed. That’s what the whole policy discussion is about. And funny thing Steve. The wealthy are in the most able to head for the doors when folks like you decide to get extra generous with their money. Just ask the Rolling Stones, Cat Stevens, John Lennon, David Bowie, etc. etc. Google “Tax Exile”.
Funny how you guys tell me to leave if I don’t want to pay taxes. I’m from Argentina, and here like most countries in Latin America we have a big government with a lot of “free” services (like TV Cable, free socker, etc) for the poor people, but the poverty keeps rising, and as more socialist the country become, more poverty we have.
So, when a government promise you security if you relegate your freedom, you end up with no security and no freedom.
Actually – liberals might agree with you because “those who produce” are actually the working class, from whose sweat the rich make their gains. How much should a leader of a business be able to reap in profit from those who team up with that leader to reap it? Do you think that it is right that it is thousands of percentage points more than the worker’s pay? If so, those on the right who yearn for the “good ol’ days” (feudalism and serfs or slaves) would agree with you. That’s one of the reasons why we Americans have watched our jobs leave our country and go to the hapless Asian who will toil for pennies on the dollar and at unregulated 12 hour/6-day workweeks.
A little perspective: https://flowingdata.com/2010/04/27/tax-brackets-over-the-past-century/ .
We’re talking about going back to the 90’s, not the 50’s (see link above).
Income distribution like we’re getting back to, like in the ’20’s, is not good for anyone, including the wealthy, unless they really are isolated in their own private world. See e.g. the MotionChart/GapMinder on http://www.stateoftheusa.org/content/new-census-estimates-provide-snapshot.php , which is probably best read as a static graph – click on the jaggy graph tab on the upper right edge. “The strong gets more, while the weak ones fade…”. BTW… if folks have better visualizations of income distro over time, please share.
@Skid–are you a moron? Would you be able to “produce” anything if there was no military to defend it from foreign nations, no police to protect it from criminals, no education system to give you the skills & knowledge to make it in the first place? If you’re truly a self-made man, why don’t you go settle on an island far, far away from the non-moronic people above who are actually debating the real issues instead of living in a world of egocentric make-believe?
I make in the $200 to 500K range and my Federal tax rate isn’t anywhere near 50%, it’s 36%. I don’t have any fancy deductions or tax shelters. I question the claim of a 50% tax; it’s doesn’t seem plausible.
Re: all the tax debating in these comments: letting the wealthy keep money to stimulate the economy only works to a certain point, but there are plenty of other good reasons to let people keep their money—like keeping the US competitive in terms of attractiveness to entrepreneurs. I think the democrat plan is not going to impact our competitiveness, and I’m convinced that the republican plan won’t help the general economy at all.
FWIW, I take some issue with the use if circles rather than bars. I recreated this graphic at http://manso.jed.co/post/1556626371/jimray-comparing-the-democratic-and-republican
New York times had a much more balanced version of this chart, this is just chart junk as others have pointed out. Taxes are in % so the chart should be in percent. Personally I would show stacked bars showing the % paid both with and without the tax cut. Done that way, it seems like the republican version is just fair, as a percentage of the bar. The rich already pay more so they get more of a cut but they still pay more.
Aren’t we missing some information to draw realistic conclusion?
– The amount of taxes paid by each layer?
– The proportion of the whole?
– The demographic repartition in each layer in % and # ?
@pierce-there’s value in showing dollar amounts because people understand the value if money—it can make the chart more compelling.
I thought people earning >$500 had accountants who ensured they paid no taxes ;-)
So, really, there’s very little difference between the two plans…
Make that >$500K
This graph is embarrassingly misleading. First of all, as others have pointed out here, it is important to represent a “reduction” in the context of what is paid. Why isn’t the percentage of earnings taken by the government depicted for each group? Second, some people here are claiming that the “top” tax rate is “only” 35%. That is not true. Many people pay more than 50% of their income in taxes, and they are not “rich” by any stretch of the imagination. BUT–we’re only talking about federal income taxes, right? Well then again, this graph is erroneous. The bottom 50% of income earners don’t pay any. Of course the top percentages of earners are going to show huge reductions…THEY PAY ALL THE TAXES! This graph is like a magic trick. It pulls the wool over your eyes. Call it “sleight of visualization.”
Maybe someone else said it, but I missed the comment.
Not only is the approach misleading (“reduction” instead of “reduction relative to amount paid”), but the context of the final category is totally missing. Certainly, it’s only a few percent of Americans who fit into that category, but to simply say that if I make $1Mil + 1 dollar, I reap the benefit as opposed to representing the actual average paid at that level (or a range).
This really is a “sensational” visualization.
you republicans won’t ever admit that you’re a bunch of selfish pricks. with all the tax loopholes out there the ultra-rich pay much less percent-wise than the middle class. it’s bullshit, and everyone knows it. democrats are calling you on your bullshit, and the republicans bend over backwards to invent reasons for why it’s not fair.
@Paul Lasiewski In one of your first comments you mentioned that “Hello……$100K IS NOT WEALTHY (any more)” and I would very much like to question your logic behind this statement. Were you referring to a family of 4 living off of 100K or a single individual? If you are referring to a family, they are not poor. Does this mean that they own three Porches and have a 3.5 million dollar house? No they probably do not (and if they do, they are living well outside their means). I am in the United States Air Force, and I make roughly 36k a year. I personally would very much consider the notion of tripling my income to make me rather wealthy.
Actually, studies show that most people who own multiple expensive cars and nice houses are living beyond their means and–far from being “rich”–are actually in debt and are technically broke as a joke. The overwhelming majority of millionaires, on the other hand, live well below their means, always pay themselves first, live in modest homes and only buy cars that are 2-7 years old. Are you actually saying that people should be taxed based on your personal conception of what being “rich” is? That makes little sense. There is a big difference between “income” and “wealth.” Many people who are taxed on $250,000+ a year actually only take home $50,000-$80,000 and are not “wealthy” by any stretch of the imagination. As for the person who ignorantly states that Republicans are greedy and that everyone knows that rich people don’t pay any taxes, see the above comments. There might be some very wealthy people who know about tax loopholes and the like, but they are a stark minority of the population and are ironically the very same Wall Street tycoons that Democrats keep giving bailouts to. About 90% of millionaires live modestly, pay taxes, live in middle class neighborhoods and are completely self-made.
Charles, can you actually cite where your version of millionaires comes from? I think you have a rather poor twist on the Horatio Alger myth going on in your head.
http://en.wikipedia.org/wiki/Horatio_Alger_myth