
A flowchart to decide what typeface to use
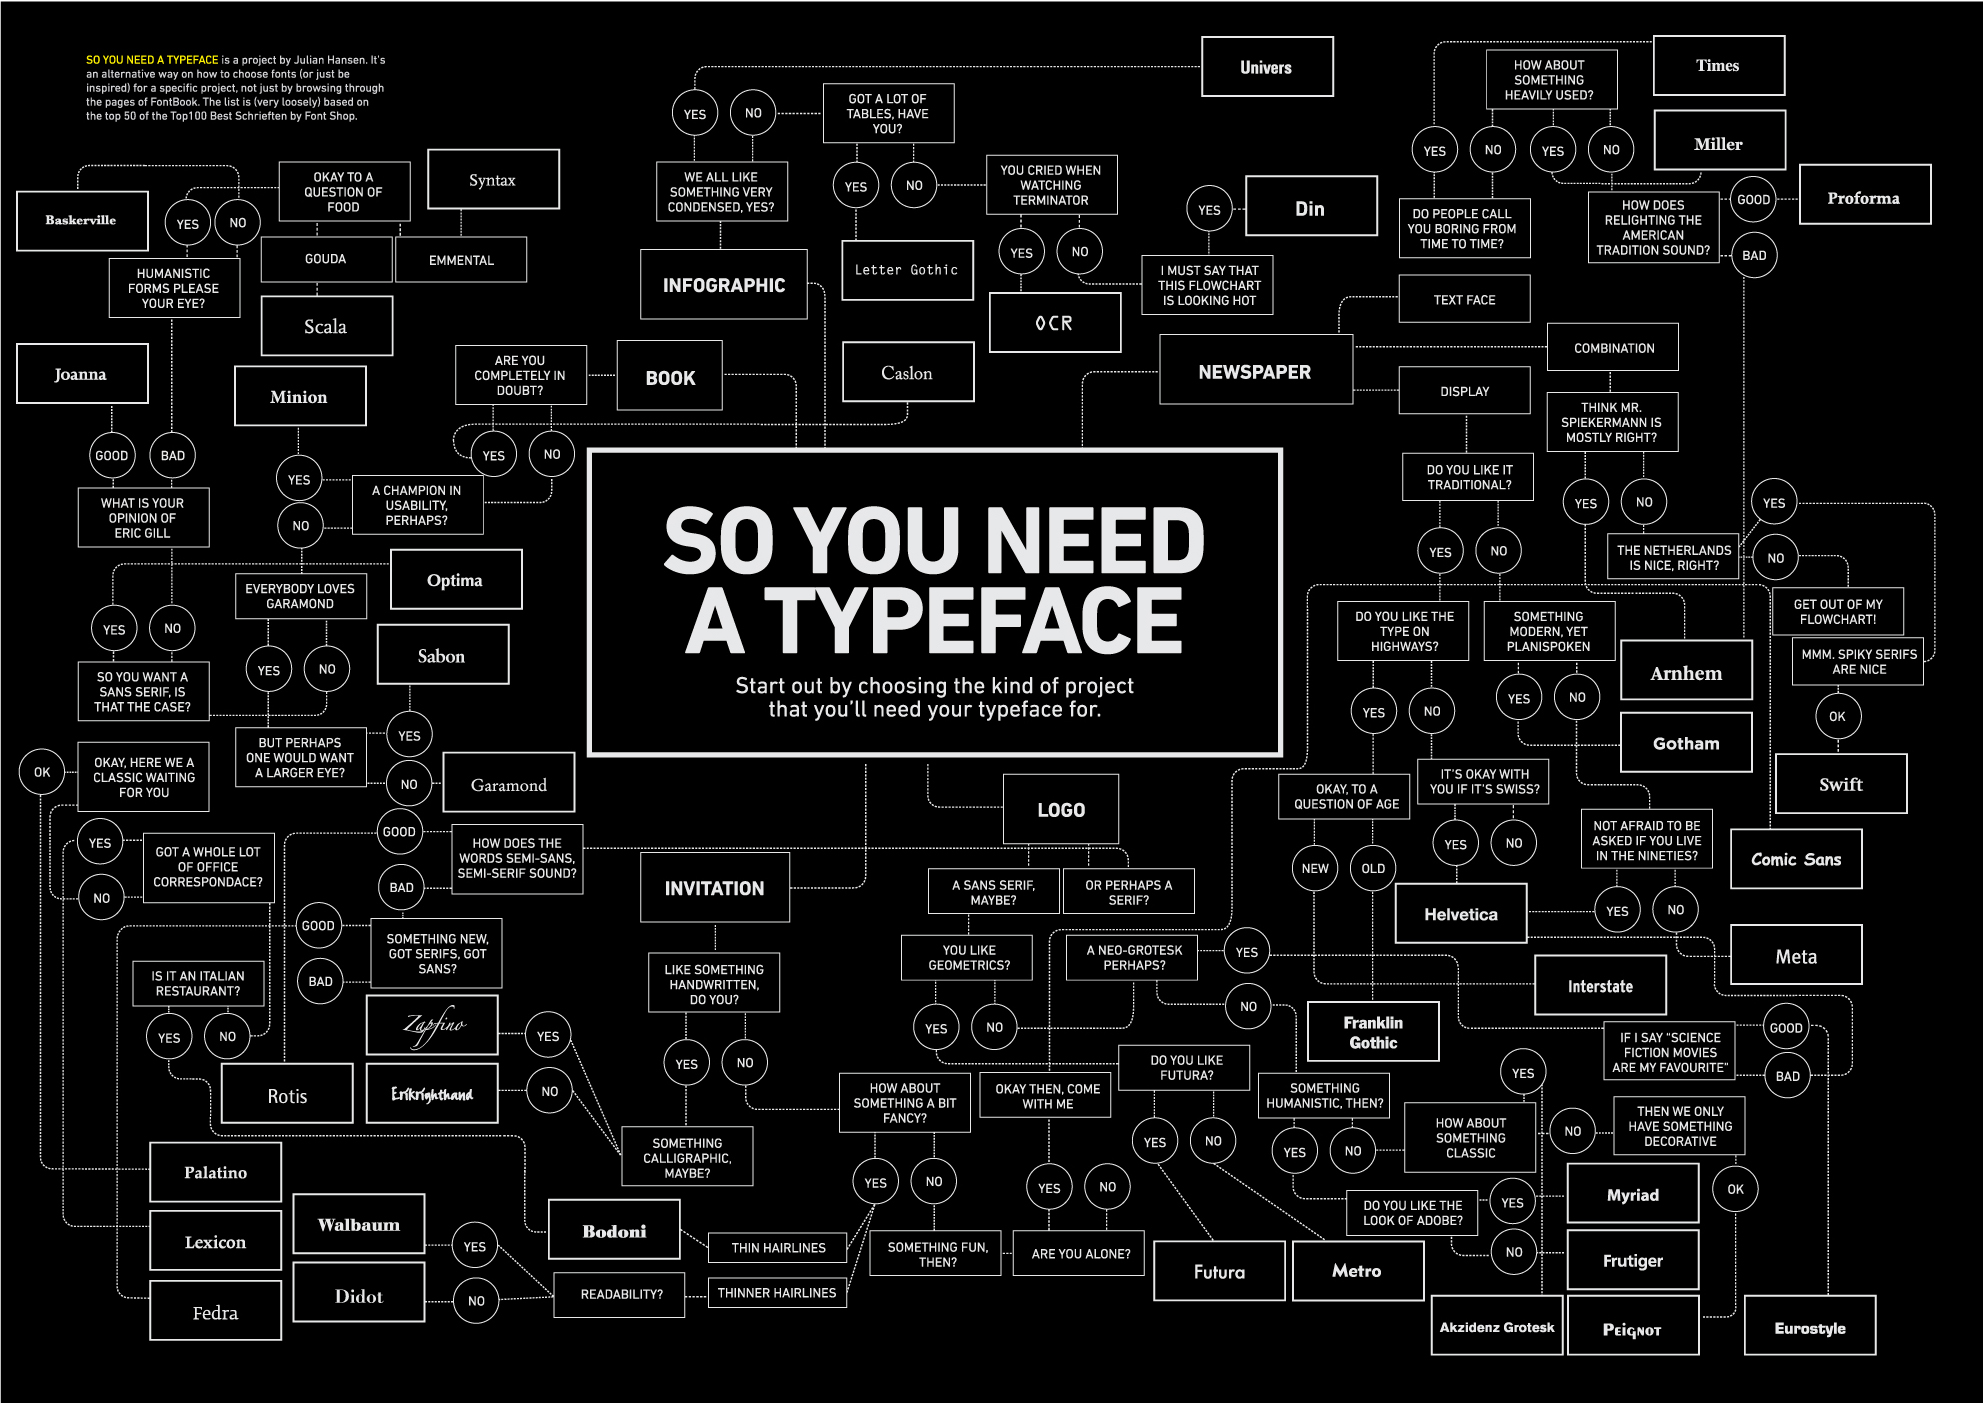
A typeface can make or break your graphic. Use Comic Sans, and no one will take you seriously ever again. Luckily, graphic designer Julian Hansen put together this flowchart for a school project to help you figure out what typeface to use. Most of you will probably be interested in the infographic branch.

I prefer to go the book route though. What typeface do you end up at?
[Inspiration Lab via DataViz]
12 Comments
Become a member. Support an independent site. Get extra visualization goodness.
See What You Get


The route to Comic Sans is amusing.
Pingback: A flowchart to decide what typeface to use « Fresh
Please – how can I see a full-size (readable) version?
click the ‘flowchart’ link in the post
Clicking “flowchart” give me an image that is only about 20% larger (and still unreadable).
right click the image on the original site, and select ‘image’ to see it at full resolution
Re: “right click the image on the original site, and select ‘image’ to see it at full resolution”
My context menu doesn’t have “image” – checked both FireFox and IE. You using a Mac?
here’s a link to the full-size image: http://julianhansen.com/files/infographiclarge_v2.png
T H A N K S !
Pingback: Pop Loser ★ So You Need a Typeface?
Pingback: links for 2010-04-25 « lugar do conhecimento
Here is where you can buy it?
http://www.scribbleoneverything.com/prints/type-o-file/so-you-need-a-typeface-poster/prod_260.html