Are there any differences in student performance between schools with small classes (as in students per teacher) and those with large classes?
The natural response is yeah, of course, because if there are less students per teacher, each student gets more individual attention from the teacher. Then again, I went to pretty big elementary and high schools where some classes were in the high thirties. It didn’t seem all that bad.
Students Per Teacher and SAT Scores
Let’s take a look at state-level student-teacher ratios and SAT scores to see if there was any difference. Click the image below for the full version.
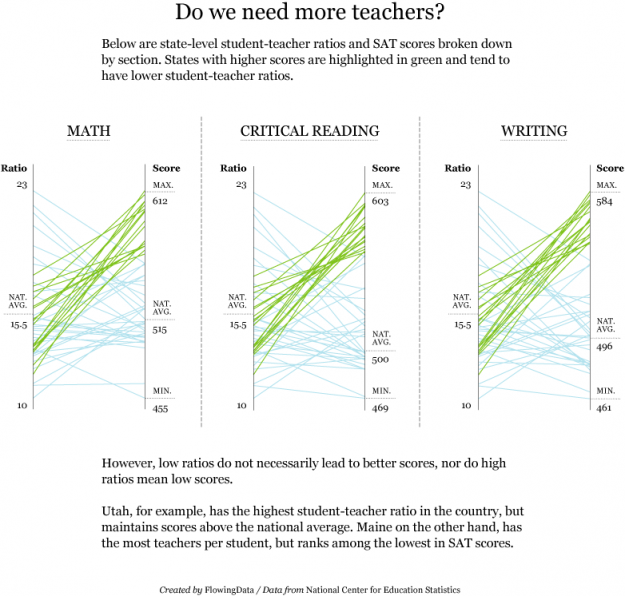
From the picture above, it does look like there is a difference. States that score highest (highlighted in green) on the SAT on average tend to have lower student-teacher ratios. High-ratio states, however, have scores that hover around the national average.
But there are also many states with ratios below the national average (small-ish classes) that score below the national average.
Maine, for example, has the second lowest ratio in the country, but also averages some of the lowest scores. On the other hand, Utah has the highest ratio, but scores well above the national average on all SAT sections.
What do you think? Does student-teacher ratio matter? Post your thoughts in the comments below.
 Visualize This: The FlowingData Guide to Design, Visualization, and Statistics (2nd Edition)
I think this is why educational theorists got into multi-level models (Harvey Goldstein at Bath or Bristol).
Nice layout. It helps show the logic (once I’d got past seeing the lines as regressions). Simply, it is unlikely kids will do well in large classes, though not impossible. But small classes alone will not do the trick.
Let’s face it, schooling is not a spectator sport! It gets done when it gets done. Prediction is not the point. Doing is the point!
All the “action” sciences need visualizations that give us feedback to guide action. Real time data displayed to give us a sense of where we are at any moment and to guide the next action.
We are hoping you’ll develop visuals for us as well as people who are “allocating budget”.
Nice.
Nice-looking graphs, but I’d prefer scatterplots.
It might be instructive to also compare class size with different measures of student performance — maybe each state’s assessments, which more directly test what teachers are supposed to teach. (The WASL for Washington State, for instance.)
In my experience, those who did well in class — or, say, had good instruction — didn’t necessarily do better on the SATs. When I took the SATs several years ago, the skills that came up weren’t necessarily ones I learned or had been tested on in school. I would question how well SAT measures learning or performance taught in a classroom.
I realize standardized testing is a hotly debated topic; I just want to make the point that other measures of student performance might be equally or more revealing.
I should add that I do overall thoroughly enjoy your work, and appreciate that it’s thoughtful and raises interesting questions about the data visualized. I wouldn’t comment otherwise.
The visualization looks nice, but is very hard to read. A scatterplot would tell the story much better. And how about calculating a correlation…
The relationships aren’t actually that clear in these charts. A scatterplot would allow for a real analysis of correlation, with a real regression line. Total student population would be a third data point that would be a useful overlay. For that matter, a district-by-district scatterplot would be even more helpful in demonstrating (or not) any supposed correlation.
Horrible use of underlying statistics. Populations between states are very different.
Maine, with “some of the lowest scores” tests 87-100% of high school graduating seniors. Utah, which “scores well above the national average” tests only 6% of seniors, presumably self-selected college-bound.
http://tinyurl.com/ykyw3ut
SAT scores have a major flaw: They aren’t mandatory. In North Carolina, where I went to high school, they were close; guidance counselors encouraged any kid with even an inkling of going to college to take the SAT. Consequently, North Carolina consistently has some of the lowest SAT scores in the country. In other states, I’ve heard that the only students who take it are the ones who are applying to a school that requires the SAT. If that’s still the case (I haven’t been a high school student in the past 11 years), you can’t accurately compare SAT scores across states without controlling for those kinds of factors.
The charts are quite hard to read, but looking at the one for writing, it looks like only 3 of the 16 states with above average ratio have a below average score in the stats tests. Conversely, something like 9 out of 28 score below average with below average ratios.
If the stats test were a reliable indicator of anything, then to me this would suggest large class sizes produce above average results.
Pingback: Class size vs. achievement : Contrarian
We need to know the number of observations in each state.
Also, I think SAT is a lot more popular in the east and ACT more popular in the west. I’m from a western state, and the only people I knew of who took the SAT were ones who wanted to go to an Ivy League school. That’s definitely a “lurking” variable.
I like this multi-panel parallel coordinates-type plot. However, the conclusions are clearly suspect due to selection bias (who takes the SAT?) and endogeneity problems (all those variables that are correlated with student-teacher ratio that also might impact SAT scores).
As a former 7-12 teacher, I had class sizes from 8 to 25 students. My classroom filled with 20 motivated 7th graders was much easier to manage (and much more successful academically) than was my classroom filled with 8 unmotivated high school seniors. The next year I had the exact opposite situation.
Though we wish the link between student-teacher ratio and achievement was simple and straightforward, classroom and school heterogeneity lead me to believe it’s a big disappointing “it depends” relationship.
Sorry, but I have to agree with John above, as well as with the supporters of a scatterplot. If you look at the link John so helpfully provided, it is profoundly split between Eastern and Western states, and by the proportion of students taking the SAT. A far more interesting infographic would be an interactive one, like the recent one in the NYT on unemployment (or Gapminder). I am imagining an interactive scatterplot, where class size is X axis, and SAT score is Y axis, and size of the data point is scaled by percentage of students who take it, or by the average parental income in the state, or by the percentage who go to school in state vs. out of state.
Making the state standardized test score the Y-axis is tempting, but in this era of high stakes tests, the states have such an incentive to make as many students as possible “pass” these tests, that they are not really comparable across states, or even year to year, as states adjust the criteria to fit their political needs.
Is there a name for this sort of graph? I don’t remember encountering this before.
As to Maine: we give the SAT to ALL kids, not just those who want to attend college. FMI: http://www.maine.gov/education/mhsa/satfactsheet.html
i agree with most commenters above, but wanted to add one different point.
I feel like you’re trying to highlight a strong correlation where there may only be a weak correlation. Instead of 2 colors I’d do a gradient from one to the other. high SAT scores would be a darker color line and with low SAT scores the lighter line in a different color. you’ll still get the effect without forcing it as much.
though i agree with the above in terms of scatterplot and selection bias.
Something somewhat fishy appears to be happening here. The ratio of students to teachers tops out at 23. The average is obviously including some really small classrooms, like special ed classrooms, or counting teachers that aren’t actually in classrooms, reading specialist, math specialists, science specialists etc. Here in California, where our wonderful legislature is abandoning small class size so that they can fund green cars and stem cell research, my 5th grader is in a class of 35 at a fairly good public school. My first grader is in a class of 24 but last year in K she was in a class of 38. It would be interesting to see the data that underlies these charts as they seem to have been produced with an agenda.
yeah, I’ll jump on the bandwagon – this is really not a good way to visualize the relationship between two quantities.. Experimenting with a different approach is commendable, but you should have probably realized that it just doesn’t work here..
i can’t experiment and then not share :)
Like many other commenters, I’d prefer a scatterplot.
Without a more readable graph I don’t think this tells us much. We need to see a correlation between the two data points.
Assuming that there is no correlation wouldn’t we see that students who achieve high scores come from student/teacher class ratios that tend to cluster around the mean (assuming a normal distribution of student/teacher ratios?) This graph looks to me like they are clustered around the mean . . .
It’s very tough to do a meaningful state by state comparison with SAT scores because of the ACT’s. The dominant test varies from state to state, with the ACT typically being more popular in midwestern states. The students in ACT-popular states that do in fact take the SAT are usually top tier students looking to attend higher caliber schools.
To address the concerns of other commenters, how about a scatterplot where the color of the dots corresponds to the percentage of students taking the SAT?
Hi Nathan,
Can we do a comparison of the chart you have drawn with a scatter plot – most likely scatter plot will be easier to read.
Secondly can we experiment with a gradient of colors as one responder has suggested
would be great to see all three togather.
paresh
I think it’s a cool experiment. I think you should color lines on a gradient though, based on the ‘slope’ of those lines… probably a red-green scale?
i can’t experiment and then not share :)
indeed, we learn as much from our mistakes as from our successes :)
I started thinking about what kind of circumstances it might be appropriate to present the data like this.
Firstly, if you were doing just rank statistics, then the slope of each line becomes meaningful – but this assumes that you are sampling from the same distributions, which is clearly not the case from the clustering of top SAT scores. In that sense the scatterplot would also fail if we only use it to draw a regression line.
If we are not doing rank statistics and are really looking at quantities, then the obviously noticeable effects are 1. a bunch of crossing lines – ie, a downward sloping cluster in a scatterplot, 2. a bunch of parallel lines, an upward sloping cluster in the scatterplot and 3. a spreading or tightening in a endpoints of a set of lines. The first two are just as noticeable in a regular scatterplot. The last one is only useful if both quantities are measured in the same units – so, say, Math SAT score vs Writing SAT score.
So I think for this plot to work, you should be either comparing ranks, or two co-measurable quantities.
Pingback: Class Size and SAT Scores By State — Some Random Dude
This is similar to the MLB salary example in the “Processing Book” (Fry).
I would’ve shifted the scales so that the averages on both sides line up (so that a line from average ratio to average score would be horizontal).
Perhaps class size to teacher ratio is not the underlying driver in determining performance on SAT exams.
What about class type? Montessori vs. charter vs. standard classroom.
Or how about private school vs. public school?
Or what about the home? Parents divorced or not? Parents both work or not?
Would any of these parameters do a better job at predicting SAT scores?
Pingback: Daily interesting articles | Aww Dip
Pingback: Class Size and SAT Scores By State | VizWorld.com
It’s really difficult to read correlation on parallel coordinate plots.
http://bit.ly/18Ij5O
I have a feeling that regression is the strongest force at play here. What do the number say?
I’d also suggest reversing the direction of the left axis (average student-to-teacher ratio) in the parallel coordinate plots. If a correlation is assumed to exist, it would be easier to see that among a set of nearly parallel lines instead of an X shape indicating an inverse relationship.
Pingback: Thomas Lotze
Everyone complains about the weather, no one does anything about it…
Scatterplot. Enjoy!
I actually made an interactive scatterplot, with some additional education data (including percent of students who take the SAT). From that, you can definitely see the two groups (states where many students take the SAT, versus states where few do). While each of the two groups seems to have an effect due to class size, overall the self-selection seems like a bigger determinant of the average SAT score (when fewer students take the SAT, only the better students tend to take the SAT).
It is a pity – it was indeed a beautiful chart!!
Will surely use the graphic in other circumstances.
Pingback: Do smaller classes mean higher SAT scores? « Grockit Blog
Good, but too many unaccounted for variables. School with low class size are typically private or higher economic and schools with high class sizes are typically urban and lower economic. (property tax)
Different states may have different class size averages but what about; money spent per student? who is tested? how many plan on going to college? Socio-Economics? state standards? etc.. there are just too may other variable to make this data valid.
Pingback: Best of FlowingData: November 2009 « Earth to Bobby