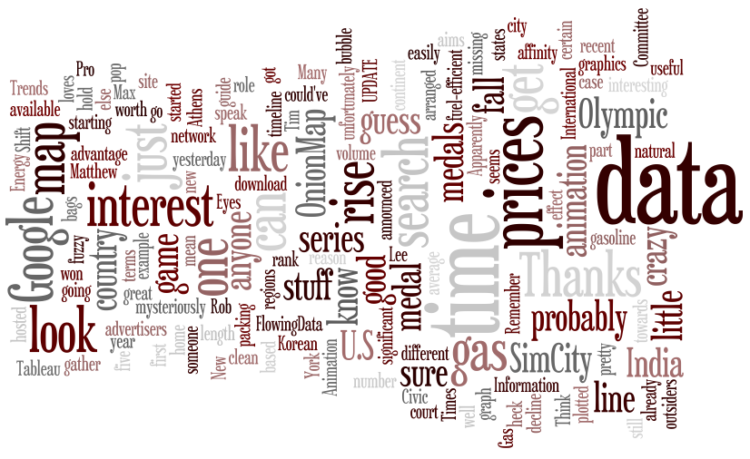
I’m sure you’ve seen Wordle by now, which puts an artistic spin on the traditional tag cloud. An application by Jonathan Feinberg, Wordle lets you put any text or RSS/atom feed in as input and get a cloud of words sized by frequency and arranged every which way. Above is a Wordle cloud of the current FlowingData feed.
Many Eyes recently added Feinberg’s visualization to their slew of other visualization tools.
Wordle marks a departure from the more analytical visualizations on Many Eyes. Why bring a self-described “toy†to a site for social data analysis? People have reported finding value beyond entertainment in creating these word clouds. Teachers have used Wordles in classrooms as conversation catalysts; others have created them to express their identities, and scholars have used them to visualize the output of statistical explorations of texts.
No doubt Many Eyes, with Martin Wattenberg and Fernanda Viégas (who know a thing or two about design) at the helm, recognizes that data visualization isn’t always about analytics and exactness. Sometimes visualization is just about getting people to think.
 Visualize This: The FlowingData Guide to Design, Visualization, and Statistics (2nd Edition)
Actionscript open source files and code for many of the visualization engines on this site are included with these books: (Flash Math Creativity: First & Second Edition) http://www.friendsofed.com/book.html?isbn=9781590594292
Enjoy!
ac_plus3: that’s pretty strange given that manyeyes is written in java!
well, not completely strange. some of it (as in one visualization, i think) is implemented in flash :) but yeah, i’m willing to bet that actually very little of many eyes is in there. it’s also a bit dated covering actionscript 2.0 and flash mx 2004.