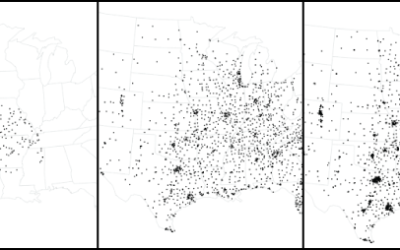
Dot Map
Each dot represents a data point. Collectively, geographic patterns emerge.
Lessons learned from mapping millions of dots
Erica Fischer, known around these parts for her dot maps, describes the lessons…
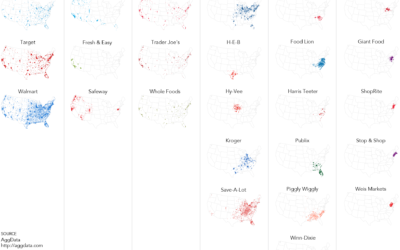
Grocery store geography
I’ve been poking around grocery store locations, courtesy of AggData, the past few…
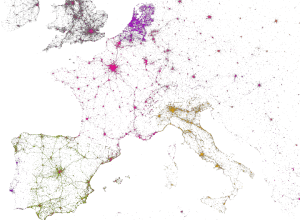
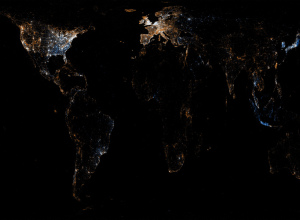
Mapping Twitter demographics
MapBox, along with Gnip and Eric Fischer, mapped 3 billion tweets and a…
How to Make an Animated Growth Map in R
Although time series plots and small multiples can go a long way, animation can make your data feel more real and relatable. Here is how to do it in R via the animated GIF route.
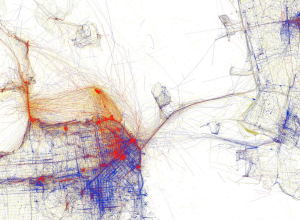
Flickr and Twitter mapped together – See Something or Say Something?
For all the maps by Eric Fischer I’ve posted, it’s amazing how little…