Visualization
Showing the stories in data through statistics, design, aesthetics, and code.
Ranking and Mapping Scientific Knowledge – eigenfactor
The Eigenfactor Project and Moritz Stefaner collaborate in these interactive visualizations “based on…
George Dubya Bush Bull’s-eye
Linda Eckstein sent this graphic along to show the main ideas of Russ…
What’s the Weather Like In Your City?
Cincinnati’s local NBC news provides viewers with a customizable weather dashboard. Look up…
New York Times Maps Twitter Chatter During Super Bowl
Twitter and maps just go well together. The New York Times maps Super…
Showcase of Student Personal Annual Reports
Some of the best stuff comes out of student projects. During the Screendesign…
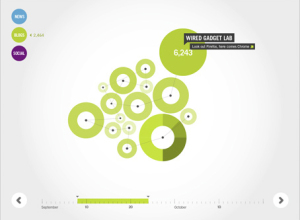
Data Visualization Sketches for Google Search Results
Grid/plane, a studio centered in Portland Orgeon, collaborated with Instrument, to visualize media…
Last Day to Put in Your Entry for Visualize This – Vote Now
A quick reminder: tomorrow is the last day to put in your entry…
Why Do Freeways Come to an Annoying Hault?
The worst thing about Los Angeles is the traffic hands down. As you…
Heavy Metal Band Names Flow Chart
Doogie Horner from Comic vs. Audience created the above flow chart for heavy…
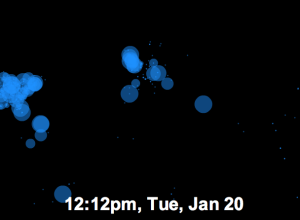
Visualizing Twitter as Barack Obama Became the 44th President
On Tuesday, January 20, 2009 at 12pm, Barack Obama officially became the 44th…
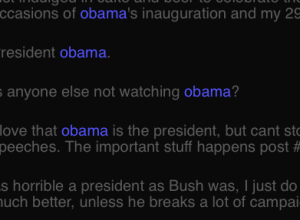
Twistori for the Inauguration
Remember Twistori? It’s the Twitter mashup that shows tweets of love, hate, think,…
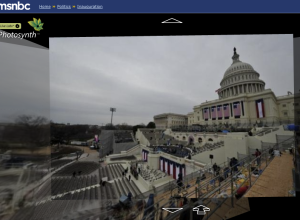
Photosynth from the Inaugural Stands on MSNBC
The Photosynth of first-hand reader photographs is now up on MSNBC. If you’re…
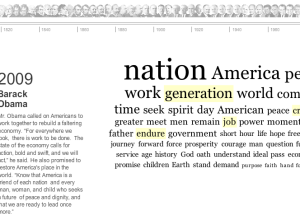
Inaugural Words From 1789 to Present
There’s a lot going on today, and of course the news interactive teams…
Guide to Inauguration Day
It’s Inauguration Day! There’s a happy buzz in the air, and you can’t…

Man vs Woman, Decision-making for Goldstar Beer
These ads for Goldstar beer were hung above bar toilets. They’re comical flow…
Fun With Words that Collectively Make Pictures
People have fallen in love with word clouds that make pictures. Zoom in…
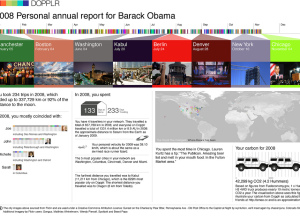
Dopplr Presents Personal Travel Report to All Users
Dopplr is a service that lets you share your travel schedule with friends…
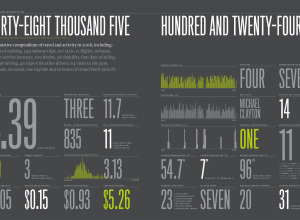
2008 Feltron Annual Report Now Available
After Nicholas Felton’s ever popular 2005, 2006 and 2007 annual report on himself,…