Visualization
Showing the stories in data through statistics, design, aesthetics, and code.
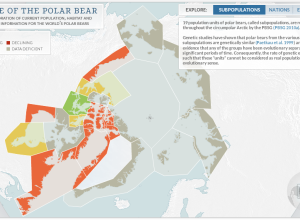
State of polar bear populations
There are an estimated 20,000 to 25,000 polar bears in the world, and…
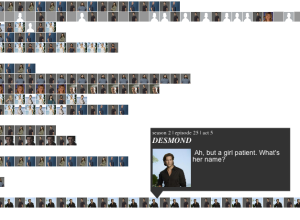
Every Lost episode visualized and recreated
Santiago Ortiz visualized every episode of the show in the interactive Lostalgic. It’s…
Game: Match states on a blank map →
In case you’re interested in learning how much you suck at US state…
Visualization for scientific discovery
Jeffrey Heer on visualization for interactive exploration:
We were visualizing the results of…
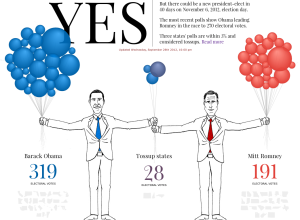
Quick sites tell you if Obama or Romney are president →
In the same spirit of the quick update site on Olympic records a…
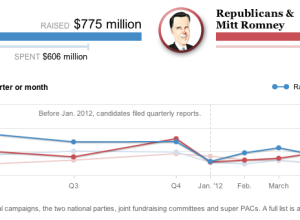
Presidential campaign finance explorer
Hey, I think it’s election season, and you know what that means. It’s…
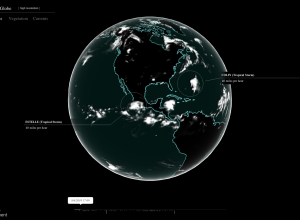
Global cloud coverage
In the latest Chrome experiment, Google mapped cloud coverage around the world in…
Bike patterns
Jo Wood, a professor of visual analytics, visualized five million bike rides using…

Data sculpture shows emotional response to Olympics
During the Olympics, Studio NAND, Moritz Stefaner, and Drew Hemment tracked Twitter sentiment…
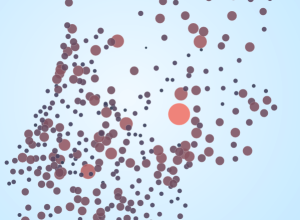
Voting similarities between Netherland cities
This month the Netherlands held national elections, and now that the results are…

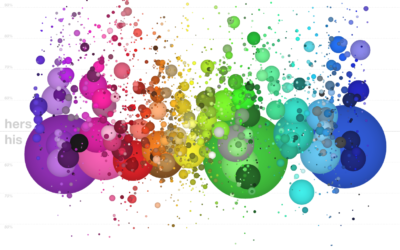
Make cool images with emergent algorithm
I’m not sure what I’d do with Ablaze.js, a JavaScript library by Patrick…
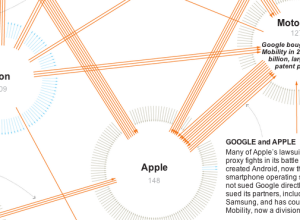
Animated political contributions
The Forest of Advocacy is a series of animations that explores the political…
Comparing Map Projections →
Slick demo showing what projections preserve and lose…
Soundscapes of city pollution
Aaron Rueben and Gabriel Isaacman used data from sampling air in tunnels, where…