Visualization
Showing the stories in data through statistics, design, aesthetics, and code.
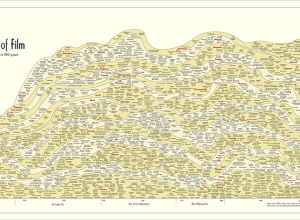
History of film, 100 years in a chart
In something of an homage to the Genealogy of Pop & Rock Music…
Beauty in movement
For the Made by Humans exhibit at the Hyundai Vision Hall in South…
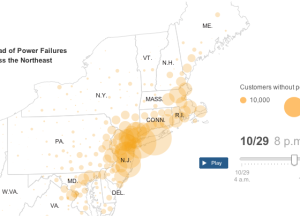
Sandy aftermath: Power outages and flooding →
The New York Times provides a detailed look at the Sandy aftermath, across…
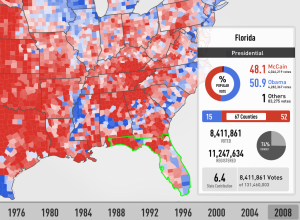
Browse elections data back to 1976 with Electionary app
Electionary, the new iPad app from TargetPoint Consulting, lets you browse national election…
Hurricane tracker for Sandy
The New York Times has an updated version of their hurricane tracker up…
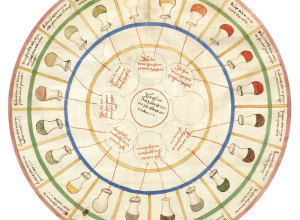
Urine wheel to diagnose disease
Some days you take a whiff it’s easy: “Yep. Definitely had asparagus last…
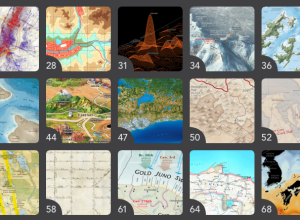
Insisting on beautiful maps
In the Atlas of Design, published by the North American Cartographic Information Society,…
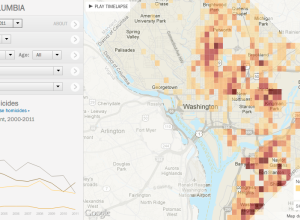
Tracking homicides in Washington, D.C. →
In a multipart special report, The Washington Post investigated homicides in the nation’s…
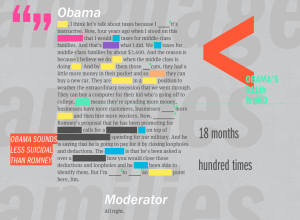
ReConstitution recreates debates through transcripts and language processing
ReConstitution 2012, a fun experiment by Sosolimited, processes transcripts from the presidential debates,…
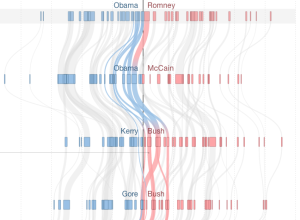
Shifting states over the decades, between Democrat and Republican →
Mike Bostock and Shan Carter visualized how states have shifted parties over the…
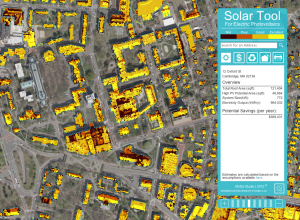
Solar energy potential, mapped in Cambridge →
Sustainable Design Lab at MIT and MoDe Studio estimated the potential hotspots for…

How viral photos spread on Facebook
Number of likes and shares for a Facebook post are just simple aggregates…
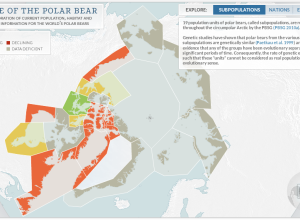
State of polar bear populations
There are an estimated 20,000 to 25,000 polar bears in the world, and…
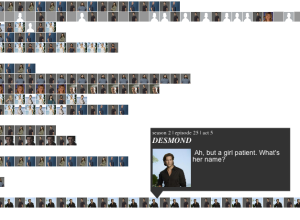
Every Lost episode visualized and recreated
Santiago Ortiz visualized every episode of the show in the interactive Lostalgic. It’s…