Visualization
Showing the stories in data through statistics, design, aesthetics, and code.

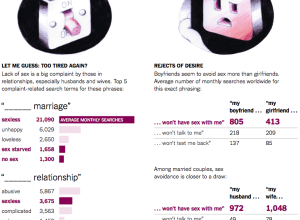
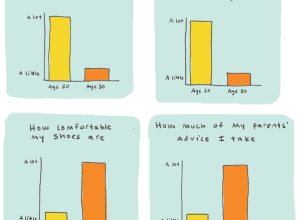
Sexual insecurities found in Google search results
Seth Stephens-Davidowitz continues with his Google search data-related op-eds for the New York…
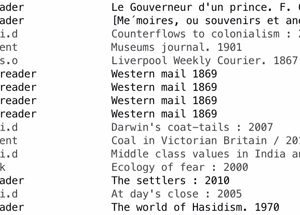
Book checkouts from the British Library
In efforts to emphasize the importance of the library (very), the British Library…

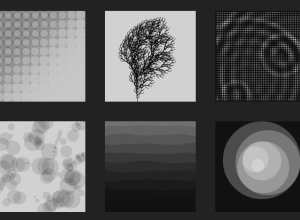
One animated art piece per day, with D3.js
Data-Driven Documents, or D3.js, is a flexible JavaScript library that lets you draw…
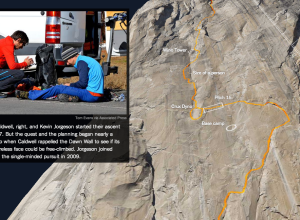
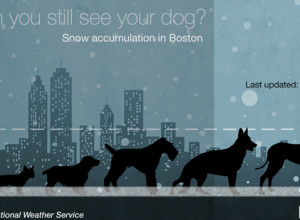
3-D model to show free-climb route
Tommy Caldwell and Kevin Jorgeson are free-climbing almost 3,000 feet up El Capitan,…

Mapped history of how Native American land was taken
In Invasion of America, an animated map shows the loss of land.…
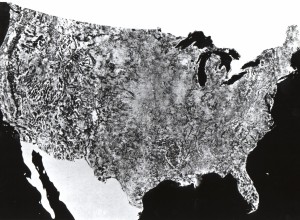
The first photo of the United States by NASA satellite
In 1974, NASA published their first satellite photo of the contiguous United States…
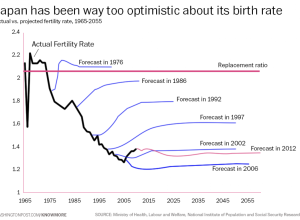
Japan fertility rate forecasts versus reality
It’s hard to predict the future, especially when humans are involved. Oftentimes, there…

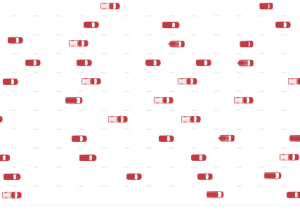
Every episode of Friends season 1, played simultaneously
All ten seasons of Friends are currently available on Netflix, but watching shows…

Rapper travels and a robot arm
Maximum Distance. Minimum Displacement. by Tahir Hemphill explores rappers’ geographic mentions in their…

Eric Rodenbeck on visualization and running a studio
Eric Rodenbeck is the founder and creative director for Stamen. No doubt you’ve…