There’s reading a book, and then there’s looking at, exploring, and experiencing a book. That’s what these 12 book visualizations are for.
Cover Pop
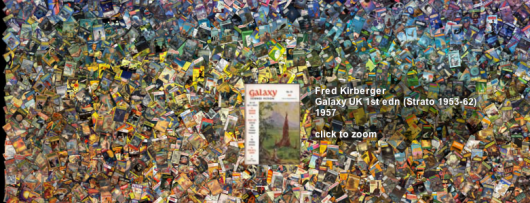
Thousands of books are displayed as one giant pile, arranged horizontally by time, and vertically by color of the cover.
Amaztype
Put in a search query, and get the results arranged in a way that spells out your query. Below was my search for visualization. I didn’t even notice that something was being spelled at first.

Four Stories
Ben Rubin’s work at the Minneapolis Public Library. It’s beautiful physical installation that shows the most recently checked out books on two elevator cab displays.

oSkope
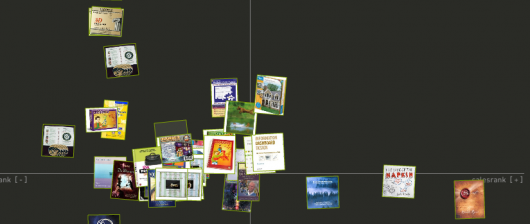
Actually five different views for books on Amazon – grid, stack, pile, list, and graph. Below is the graph view which shows books on a two-dimensional graph with price on the y-axis and sales rank on the x-axis.
Text Similarities
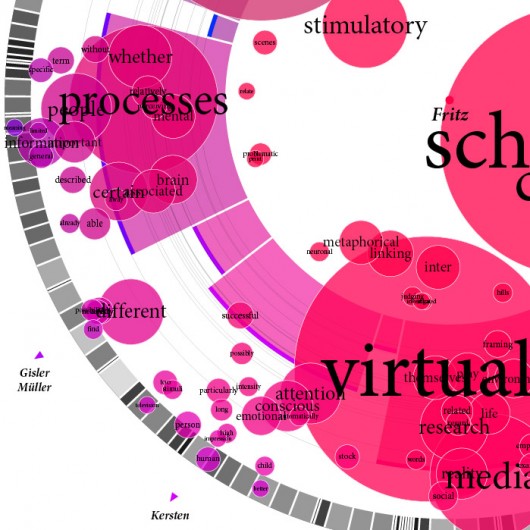
Taking a look at the similarities between works of text. Radius is word count and central angle represents coinciding words.
Touch Graph Amazon Browser
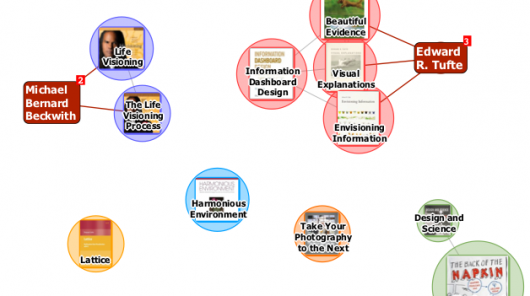
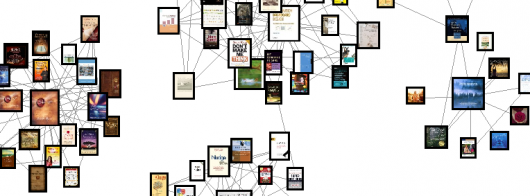
Books arranged in network graph format. Type in a search term and get initial search results; wait a little longer and related books will start popping up.
TextArc
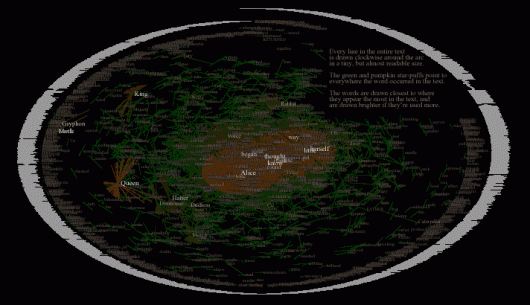
An oldie, but a goodie. Most well known for visualizing Alice in Wonderland in a way we’d never seen before. TextArc is one of my favorites.
Amaznode
Amaznode is similar to the previously mentioned Touch Graph, putting search results and related book in network graph form.
Literature Map
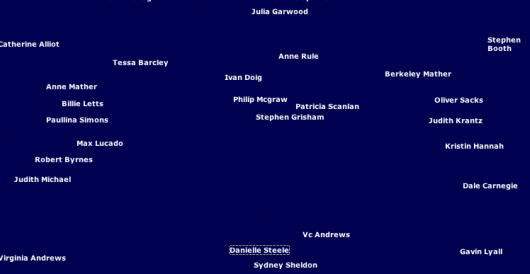
This one focuses on the authors and uses some kind of multidimensional scaling to place similar authors closer to each other.
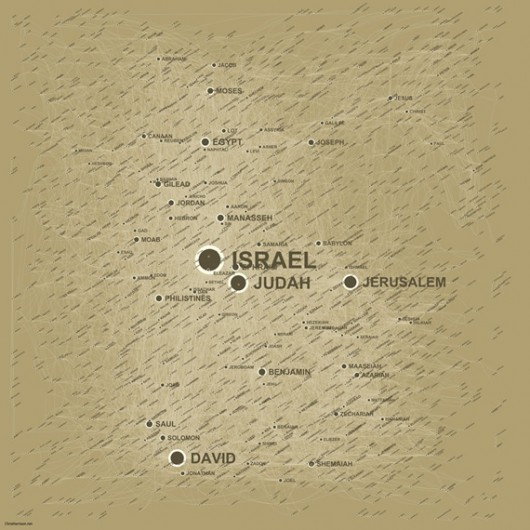
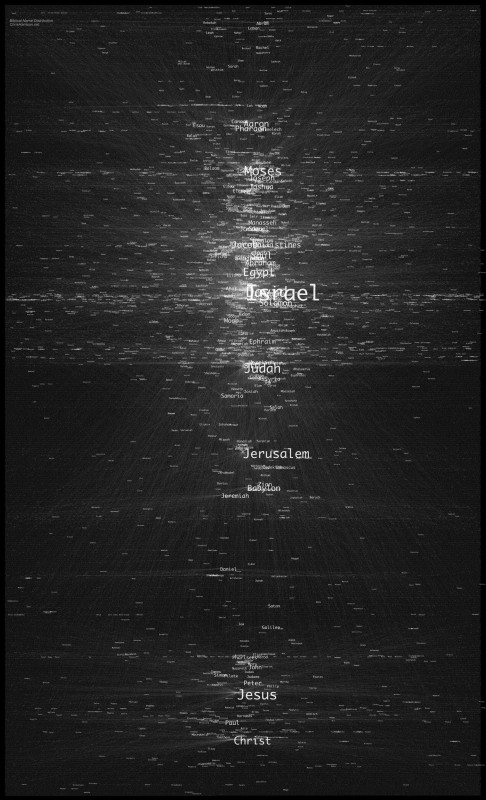
Bible Cross References, Social Network, and Distributions
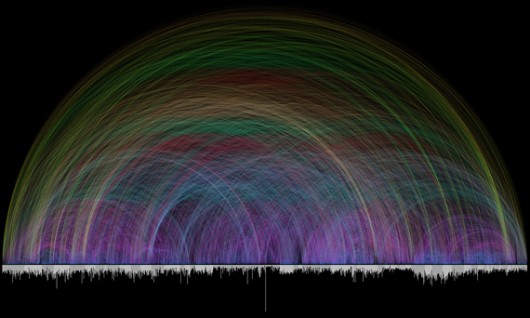
This is actually three different visualization by Chris Harrison for the grand daddy of all books in the world (sales-wise) – the Bible.

 Visualize This: The FlowingData Guide to Design, Visualization, and Statistics (2nd Edition)

Very cool Nathan, very cool!
Very cool Nathan, very cool!
My first diagram in grad school was an interesting visualization of a (generic) book that encoded both hierarchy and usage. Not quite the same as these, in that it is an abstraction of structure, not a specific book, but related.
Here it is:
http://complexdiagrams.com/2007/10/12/hierarchy-of-a-book/
-Noah
Very nice survey! I’m developing a visualization to describe both word frequency and semantic similarity, the “tree cloud”. For example for the beginning of 1984: http://philippe.gambette.free.fr/Blog/200803TreeCloud/1984TreeCloud.png
Pingback: BEAT Internacional » Blog Archive » Maneras innovadoras de visualizar y explorar libros por internet
Pingback: La Feuille » Archive du blog » Graphe de livres
Hey, you missed the original… from 1999!
http://www.orgnet.com/booknet.html
used in the US political book maps
http://www.orgnet.com/divided2.html
Hey, you missed the original… from 1999!
http://www.orgnet.com/booknet.html
used in the US political book maps
http://www.orgnet.com/divided2.html
You also missed this one, a zoomable UI interface.
http://zoomii.com
You also missed this one, a zoomable UI interface.
http://zoomii.com
Pingback: 25+ bodacious and inspirational visualizations for data, interactivity and new storytelling forms | Will Sullivan's website. Journerdism
Pingback: Más ejemplos de visualización | Vectart
Pingback: Bachelor-Arbeit » Link-Liste