Halloween logicals

Oct 26, 2020

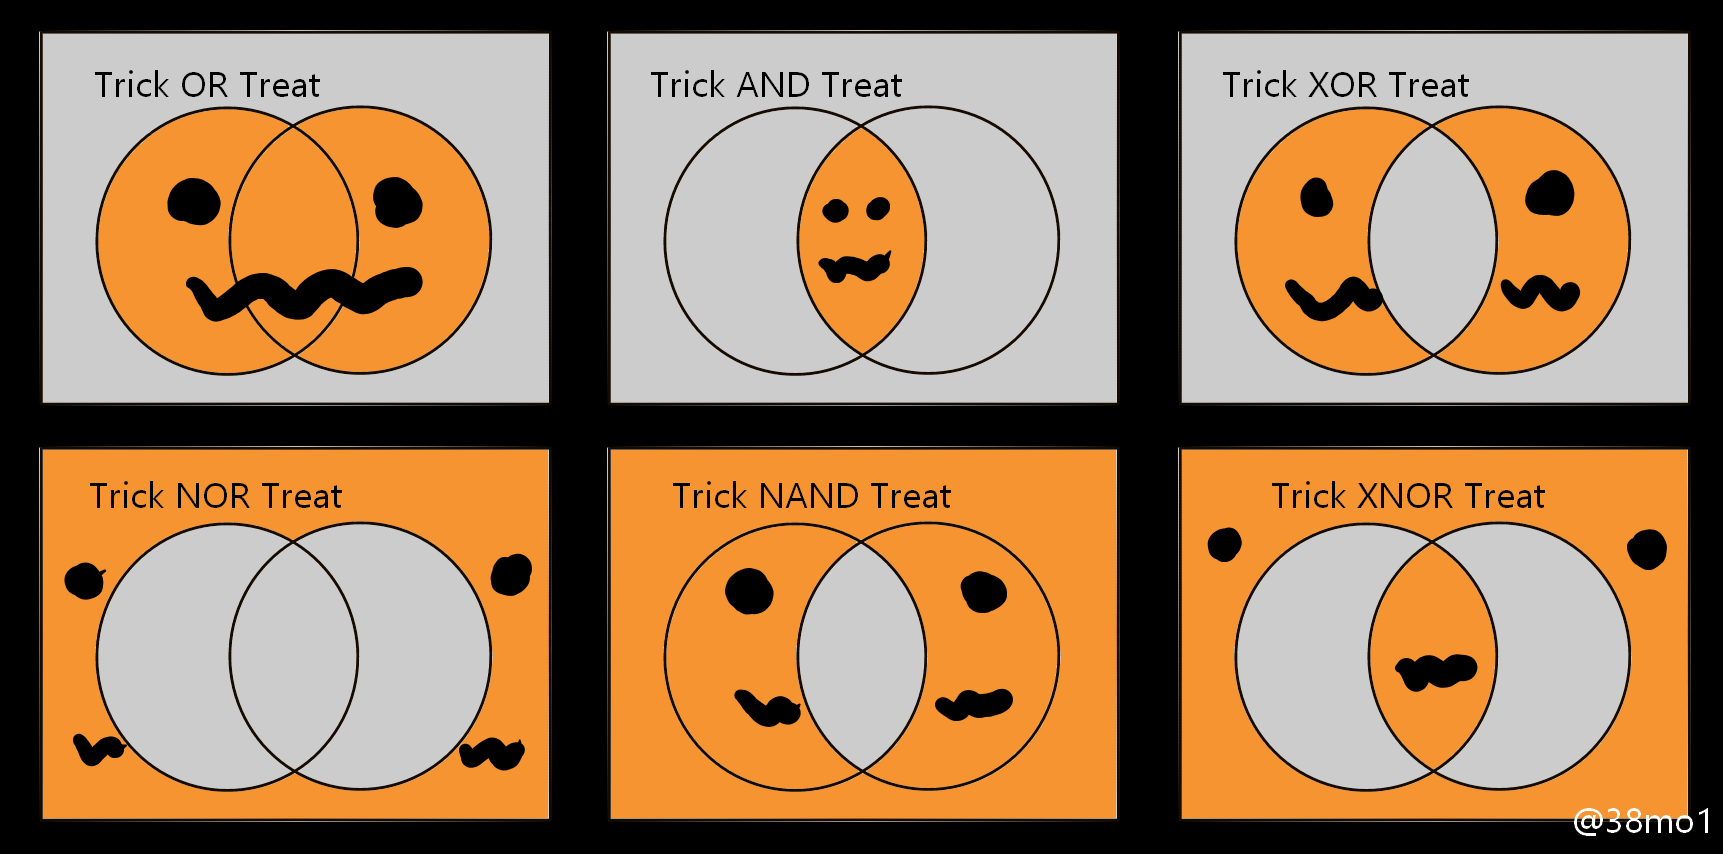
From Kaz Miyamol, these Venn diagrams present very important information about Halloween.

Become a member. Support an independent site. Make great charts.

See What You Get

Favorites

Who is Older and Younger than You

Here’s a chart to show you how long you have until you start to feel your age.

Top Brewery Road Trip, Routed Algorithmically

There are a lot of great craft breweries in the United States, but there is only so much time. This is the computed best way to get to the top rated breweries and how to maximize the beer tasting experience. Every journey begins with a single sip.

Watching the Growth of Walmart

The ever so popular Walmart growth map gets an update, and yes, it still looks like a wildfire. Sam’s Club follows soon after, although not nearly as vigorously.

Visualizing the Uncertainty in Data

Data is an abstraction, and it’s impossible to encapsulate everything it represents in real life. So there is uncertainty. Here are ways to visualize the uncertainty.