Mapping When and Where People Start their Commute
For commuters, the farther away you live from the workplace, the earlier you have to leave your house to get to work on time. That’s obvious. But how much does that start time change the farther out you get?
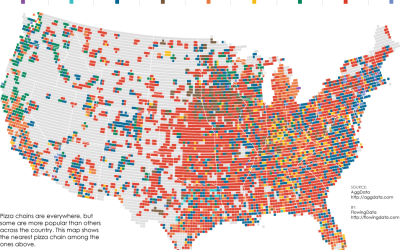
The maps below show the median start time for those who work in major cities in the United States. Blue means an earlier start time and green means later. Each map provides an image of how far out the morning rush begins.
Click for larger images.


These are based on data from the five-Year American Community Survey for 2013 through 2017, which is run by the U.S. Census Bureau. I downloaded the data via IPUMS. The survey asks respondents when they usually leave for work, so it seemed straightforward to map the median of a single variable for each city.
Of course that wasn’t quite the case. There’s always a few bumps along the way.
Geography can get a little tricky when working with microdata from the Census Bureau. For privacy reasons, the lowest level of geography provided is called a Public Use Microdata Area, or PUMA for short. Each area has at least 100,000 residents. The survey also asks for place of work, but location is bundled in a different geography called the Place of Work PUMA. As I understand it, the PWPUMA typically matches the boundaries of one or more PUMAs together.
Then if you go with a one-year sample instead of the five-year that I used, you end up with sparse geographic coverage. So if you want a more detailed view, you need to increase the number of years. That took a few downloads for me to figure out.
After that, I mapped the median start time for each PUMA, but on second thought, that wasn’t useful. If you just do that, that median also represents the people who live in the same area that they work in. I was more interested in when people commute to other areas, mainly from suburb to city.
So I adjusted again.
First I subsetted people by where they work (PWPUMA). For example, I grouped all of the people who work in the Los Angeles area. Then I counted by where those people live (PUMA) and calculated the medians for each area. The above areas are the thirty PWPUMAs that had the most workers.
That got me most of the way there. I didn’t like how the large outer regions got so much visual space though. So I used shapefiles that I downloaded from the Census Bureau for the area of each PUMA, which I used to calculate number of workers per square mile who were commuting to a PWPUMA. That seemed to provide a better sense of flow to the static maps.
For more context, I grabbed primary roads from TIGER/Line and populated places from Natural Earth.
In any case, after maybe a bit too much time tweaking graphical parameters in R, I got to the maps above. It was an interesting side trip from something else I’m looking at. But more on that later.
Notes
- The data comes from the five-Year American Community Survey for 2013-2017. I downloaded the microdata via IPUMS, which makes it easier to extract the data you need.
- I analyzed the data and made the maps in R.
- Related tutorials: Choropleth Maps and Shapefiles; Working with Map Projections and Shapefiles; Mapping With Shapefiles in R – Getting Started
Become a member. Support an independent site. Get extra visualization goodness.
See What You Get