Ben Schmidt uses deep scatterplots to visualize millions of data points. It’s a combination of algorithm-based display and hiding of points as you zoom in and out like you might an interactive map. Schmidt describes the process and made the code available on GitHub.
Millions of data points with deep scatterplots
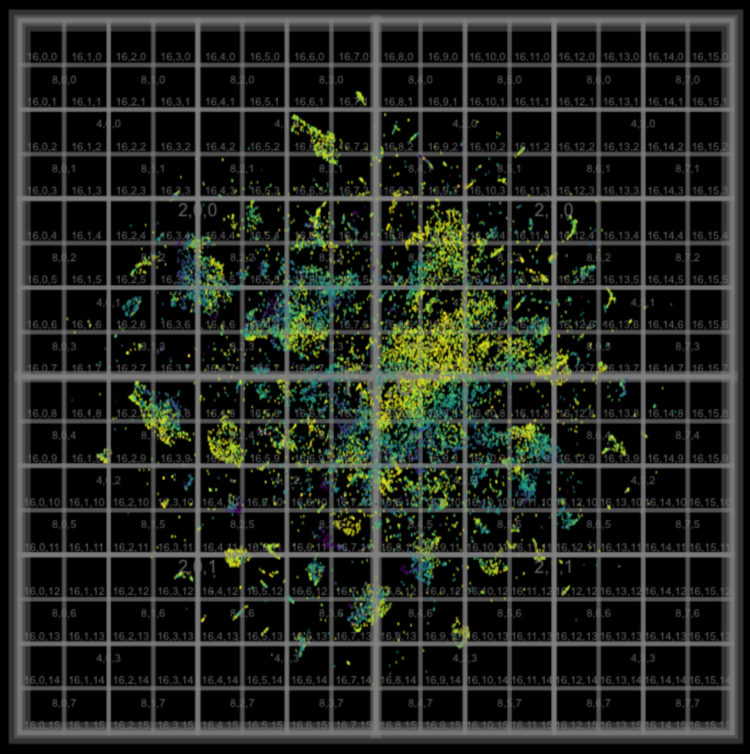
Chart Type Used

Second Edition
 Visualize This: The FlowingData Guide to Design, Visualization, and Statistics (2nd Edition)
 Visualize This: The FlowingData Guide to Design, Visualization, and Statistics (2nd Edition)
New tools, refined process.