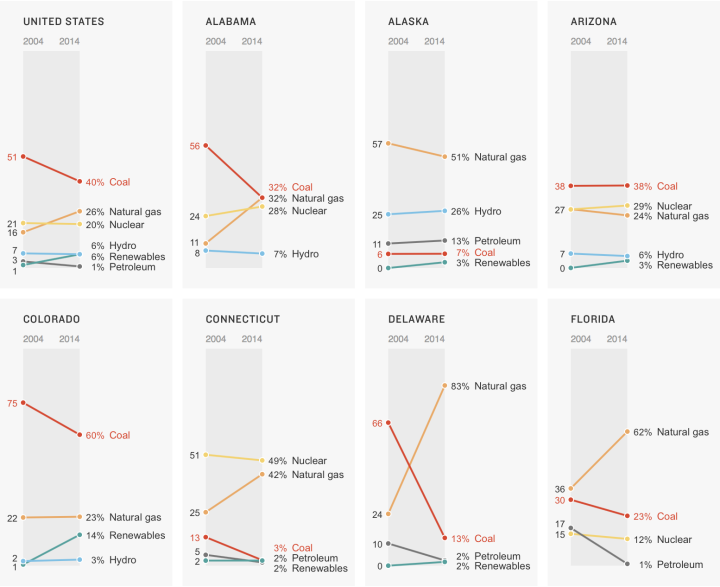
In a clean and simple set of slope charts, Alyson Hurt for NPR shows the shifts in power sources — coal, gas, nuclear, hydroelectric, and renewables — from 2004 to 2014. As you might guess, coal power output is down in most states and natural gas is up. On a national scale, the hydroelectric and renewable sources need more time.
Grab the data from the U.S. Energy Information Administration to look yourself.

 Visualize This: The FlowingData Guide to Design, Visualization, and Statistics (2nd Edition)