Network of statistical distributions
Feb 28, 2025

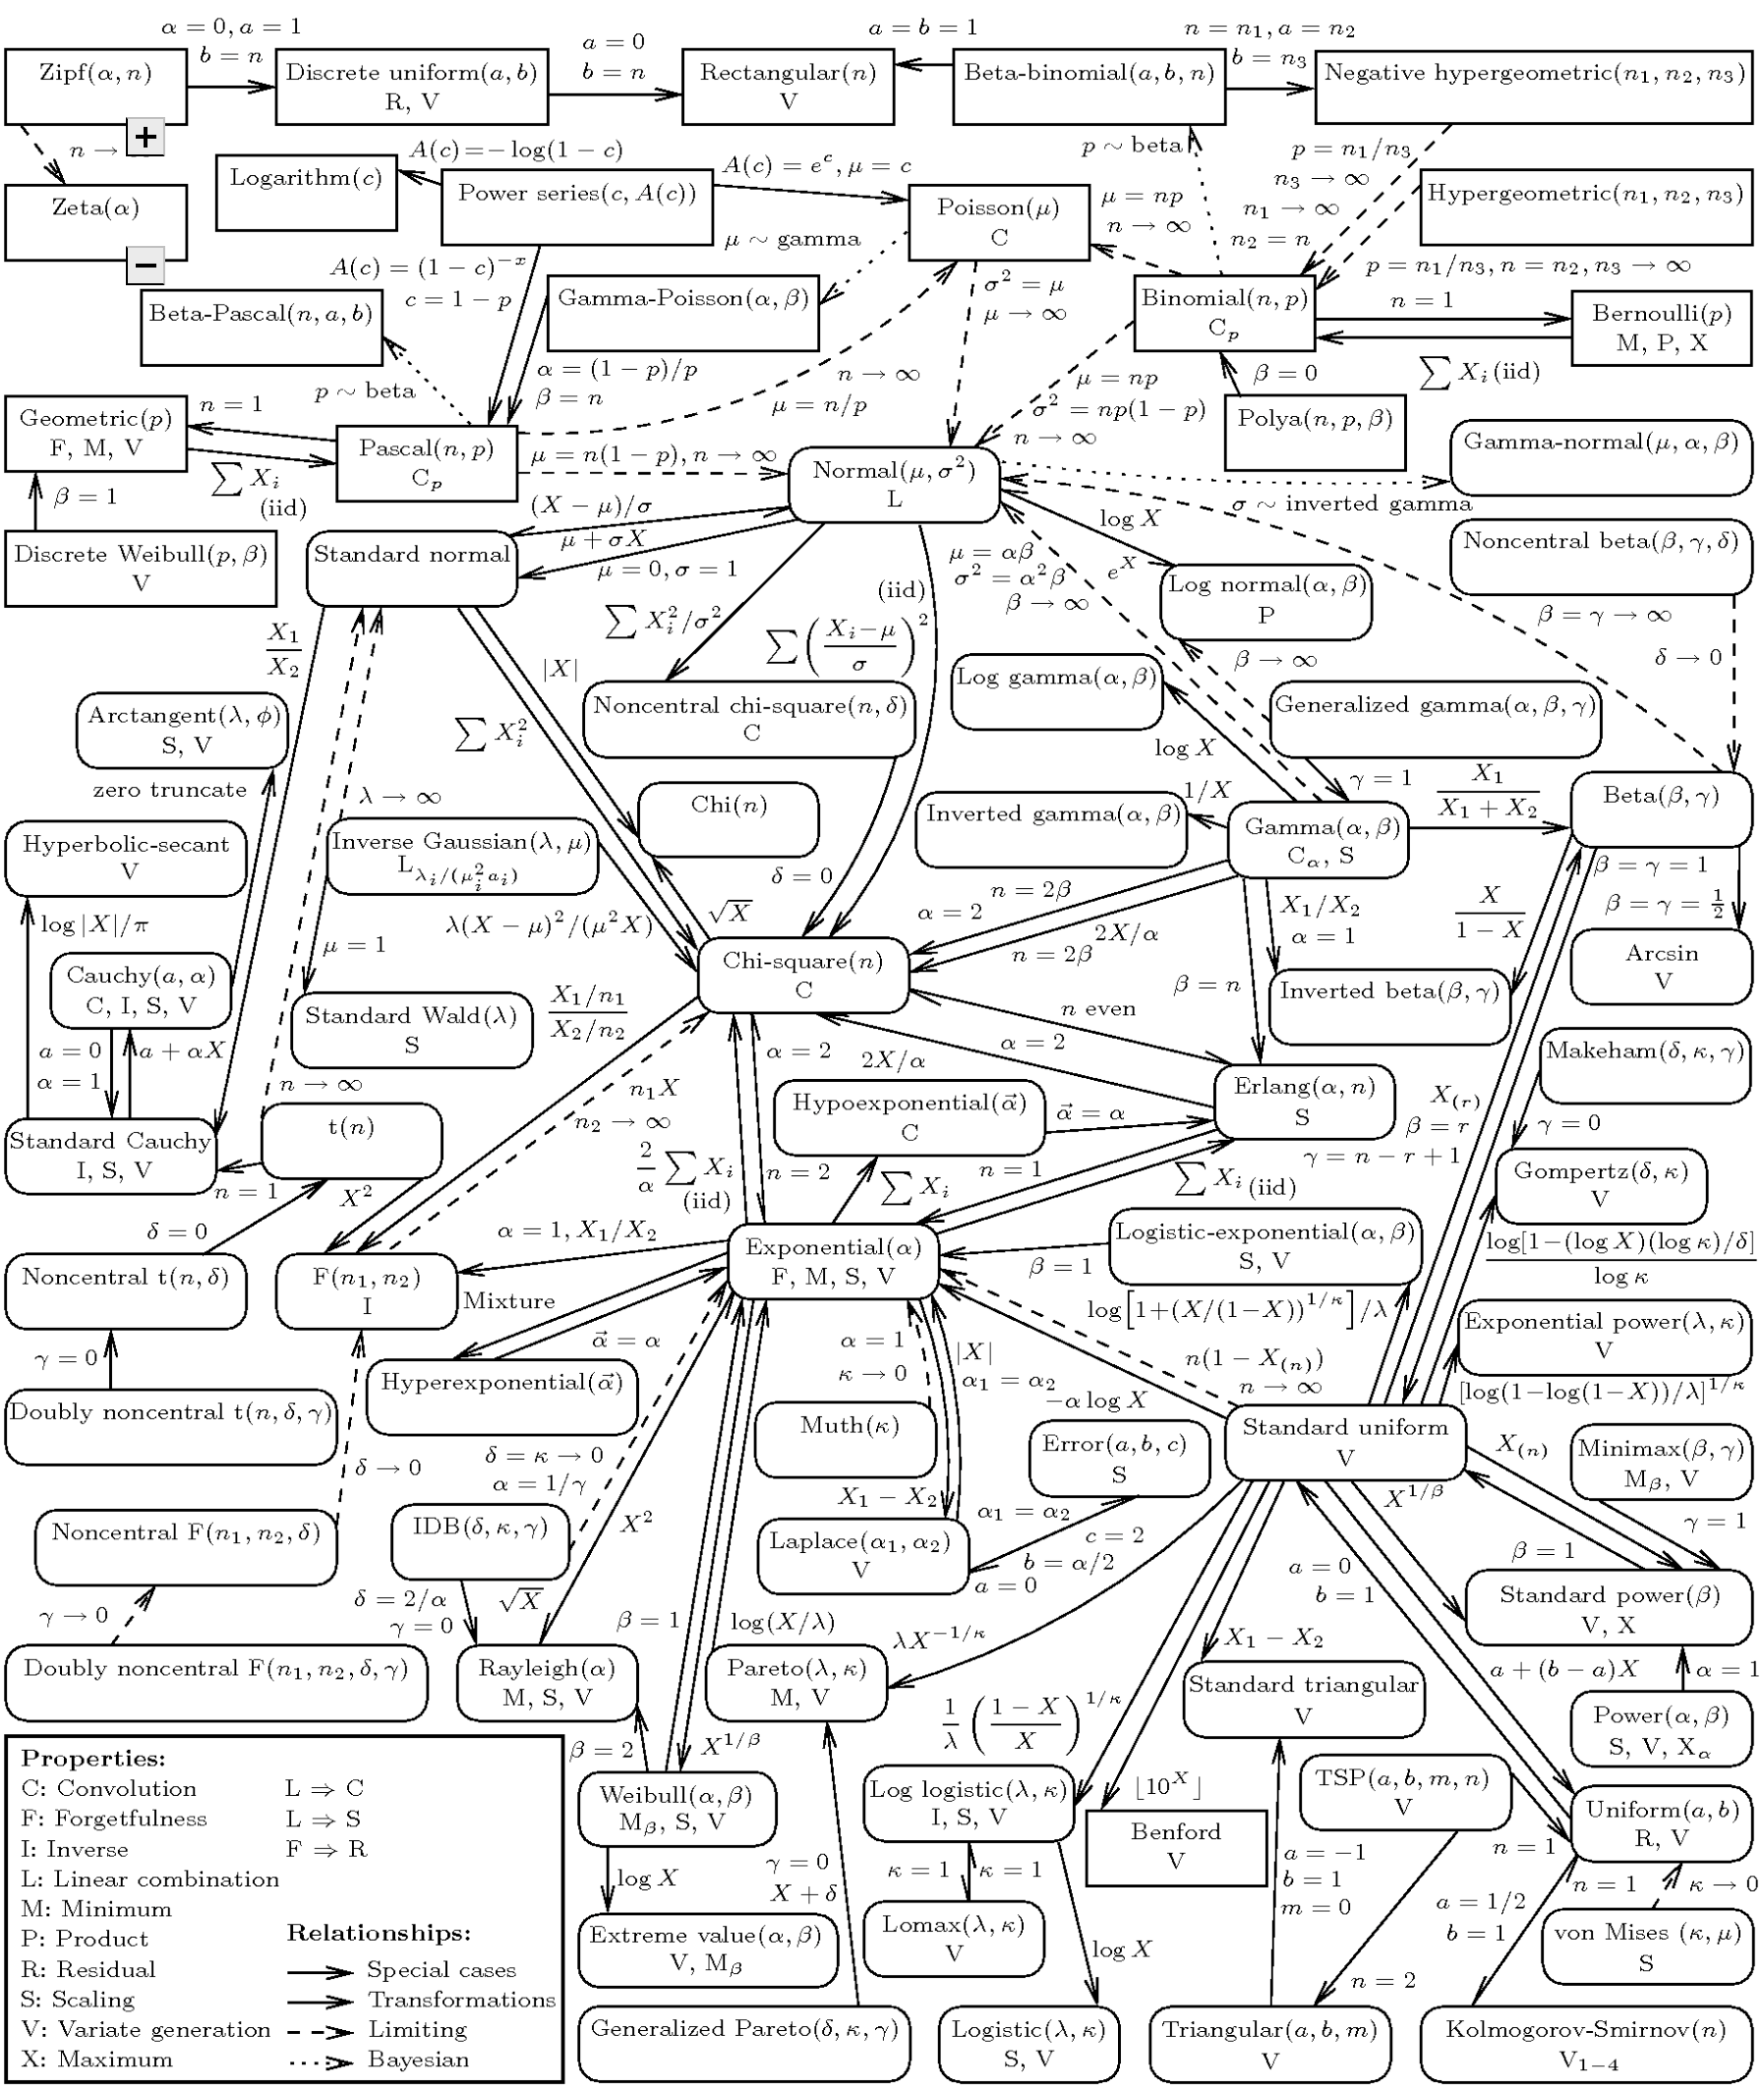
The network of 76 probability distributions show how they are connected:

Solid lines represent special cases and transformations from one distribution to another.

Dashed arrows are used for asymptotic relationships, typically as the limit as one or more parameters approach the boundary of the parameter space.

Dotted arrows represent Bayesian relationships.

Well, I guess that clears things up.

Become a member. Support an independent site. Make great charts.

See What You Get

Favorites

The Best Data Visualization Projects of 2014

It’s always tough to pick my favorite visualization projects. Nevertheless, I gave it a go.

10 Best Data Visualization Projects of 2017

It was a rough year, which brought about a lot of good work. Here are my favorite data visualization projects of the year.

Jobs Charted by State and Salary

Jobs and pay can vary a lot depending on where you live, based on 2013 data from the Bureau of Labor Statistics. Here’s an interactive to look.

How Much the Everyday Changes When You Have Kids

I compared time use for those with children under 18 against those without. Here’s where the minutes go.