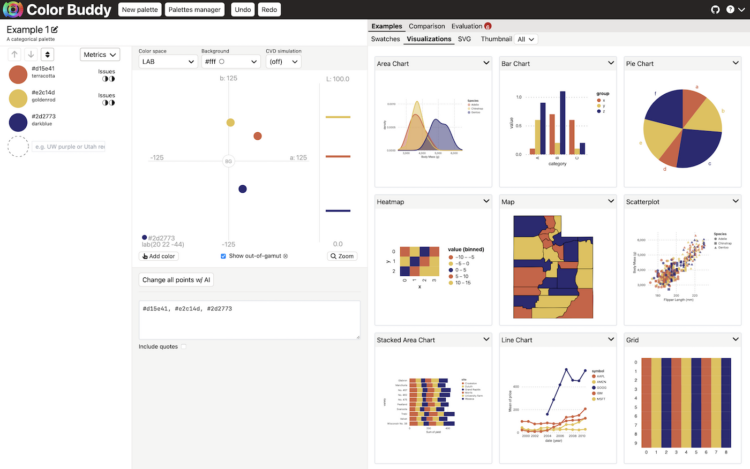
Picking colors for visualization can be tricky, because there are infinite possibilities across the color spectrums. Often you’ll want to adjust hue, saturation, and lightness separately or together. Then you need to know what it actually looks like with your charts. Color Buddy might be the tool you need.
The goal of Color Buddy is to help you make excellent color palettes for data visualization via a direct manipulation environment that evaluates your color palettes as you go.
You might think that there are enough color-picking tools for visualization, but you’re wrong. There’s never enough and there never will be.


