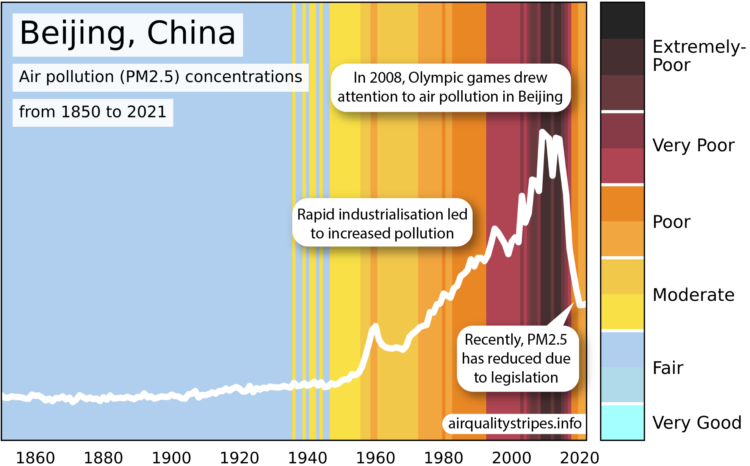
In a riff on Climate Stripes, which shows global temperature change as a color-coded barcode chart, Air Quality Stripes uses a similar encoding to show pollution concentration from 1850 through 2021.
Air Quality Stripes


In a riff on Climate Stripes, which shows global temperature change as a color-coded barcode chart, Air Quality Stripes uses a similar encoding to show pollution concentration from 1850 through 2021.