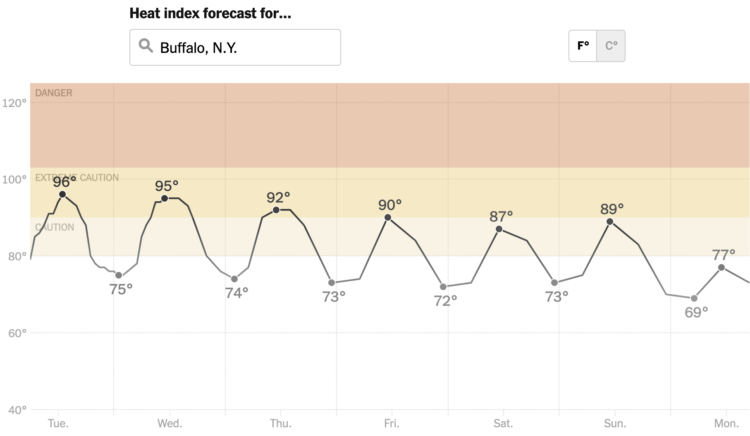
It’s abnormally hot in a large portion of the United States, and it’s going to stay that way for a few days. The New York Times has a heat tracker to show the areas with dangerous high temperatures and how long it will last.
A searchable line chart shows background bands for heat index levels, and a subtle gray to black gradient on the line reinforces the peaks.
Stay indoors and stay hydrated.
 Visualize This: The FlowingData Guide to Design, Visualization, and Statistics (2nd Edition)