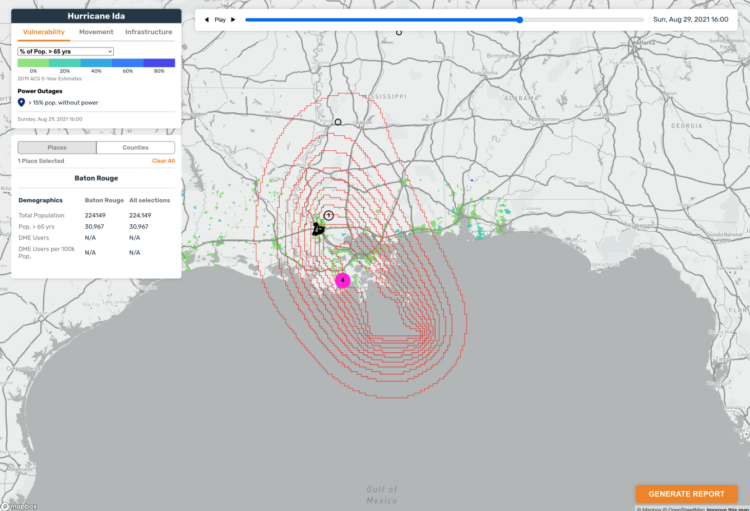
Stamen, whose design breakdowns I always appreciate, discusses why they took a different route to to show the uncertainty of wind speeds:
Wind speed probability data shows you the likelihood of sustained wind speeds that denote a category 1 hurricane (74+ mph). The way the data appears on a map is through concentric polygons that denote progressively less likely areas to experience a category 1 hurricane. We had bands showing the breakdown by 10%, but felt that given how much other data we needed to show, paring back the number of circles would be best. We ultimately decided on showing 90%, 50%, and 10% chance areas of category 1 hurricane. The team, and our stakeholders, agreed that this way of showing hurricane forecasting was far more precise than the cone of uncertainty. Wind speed probability data shows specific degrees of hurricane likelihood compared to only emphasizing one area like with the cone. Put simply, the cone of uncertainty tries to do too much at the cost of specificity.
See also: the challenges in reading the more common cone of uncertainty.
 Visualize This: The FlowingData Guide to Design, Visualization, and Statistics (2nd Edition)