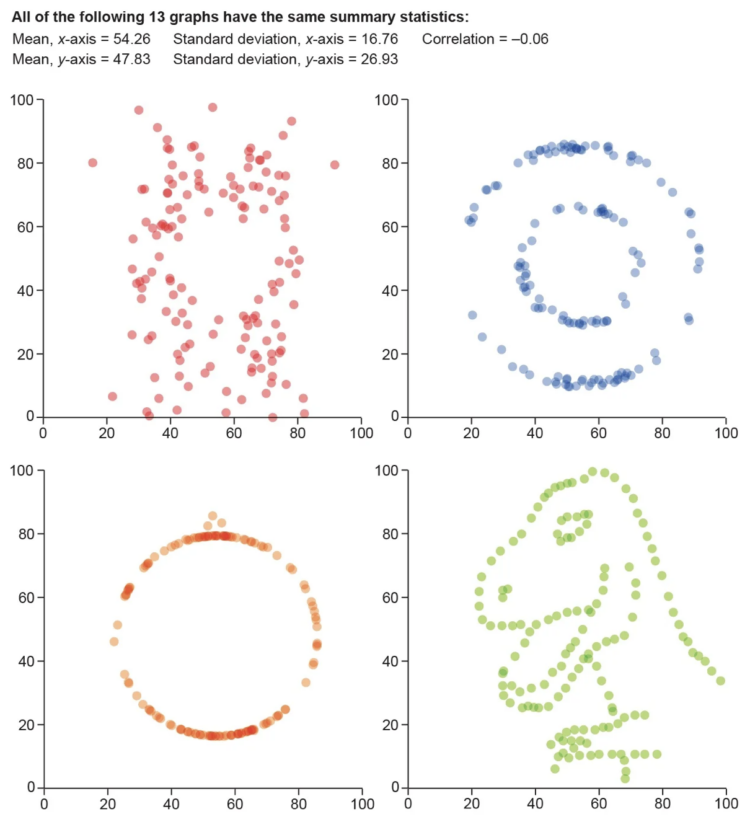
For Scientific American, Jack Murtagh describes the importance of visualization in understanding the roughness of data:
One maxim that should be etched into the walls of all scientific institutions is to visualize your data. Statistics specializes in applying objective quantitative measures to understand data, but there is no substitute for actually graphing it out and getting a look at its shape and structure with one’s own eyeballs. In 1973 statistician Francis Anscombe feared that others in his field were losing sight of the value of visualization. “Few of us escape being indoctrinated” with the notion that “numerical calculations are exact, but graphs are rough,” he wrote. To quash this myth, Anscombe devised an ingenious demonstration known as Anscombe’s quartet. Together with its wacky successor, the datasaurus dozen, nothing more dramatically communicates the primacy of visualization in data analysis.


