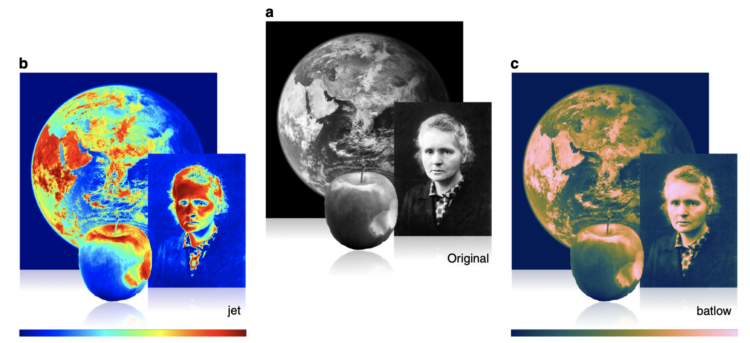
Fabio Crameri, Grace Shephard, and Philip Heron in Nature discuss the drawbacks of using the rainbow color scheme to visualize data and more readable alternatives:
The accurate representation of data is essential in science communication. However, colour maps that visually distort data through uneven colour gradients or are unreadable to those with colour-vision deficiency remain prevalent in science. These include, but are not limited to, rainbow-like and red–green colour maps. Here, we present a simple guide for the scientific use of colour. We show how scientifically derived colour maps report true data variations, reduce complexity, and are accessible for people with colour-vision deficiencies. We highlight ways for the scientific community to identify and prevent the misuse of colour in science, and call for a proactive step away from colour misuse among the community, publishers, and the press.


