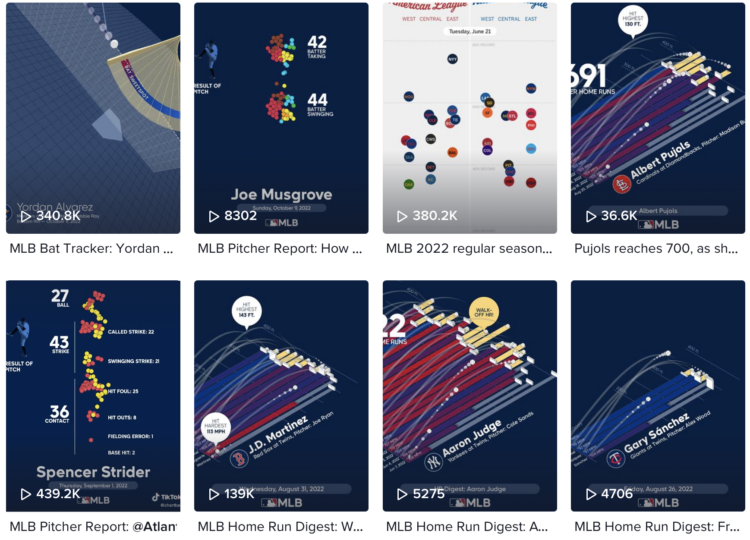
With Chartball, Andrew Garcia Phillips has visualized sports data for a while, publishing to various mediums — Twitter, Tumblr, posters, and YouTube — to show animated and engaging insights on how individual teams and players perform. It’s clearly a passion project, because no one would make this many charts if they didn’t enjoy it.
TikTok might be the best fitting platform for his short animations focused on a single insight. Here’s an example:
@chartball MLB Pitcher Report: @Atlanta Braves Spencer Strider vs. @Colorado Rockies Sept. 1, 2022 @mlb #baseball #dataviz ♬ It Was A Good Day – Ice Cube
This makes me wonder (1) how other animations and datasets would work in this short video format and (2) if you add music to any animated chart does it instantly make it more fun, because I think it does. [Thanks, Sarah]


